
LaDawn Reid
Data Analyst
Welcome! I'm excited to share my journey with you. I'm continually learning and growing, so check back occasionally for new additions to my portfolio.
About Me
Thanks for taking a few moments to learn a little more about me. My interest in data analytics started when I realized how much data exists in the world today, and recognized there was a need to make sense of it all. I enjoy discovering trends in the data, and when I combine that with my natural technical abilities, it's helping me grow in this field. The best part is knowing that my insights can directly impact business success.My extensive background in banking, finance, and operations has taught me to think critically about business challenges using both analytical thinking and practical understanding. I am a constant learner, so whether I'm mastering new data analysis techniques or focusing on personal growth, my belief in putting my best foot forward is reflected in everything I do. I also enjoy encouraging others and finding small ways to make everyday life a little better. I hope to connect with you soon!
You don't have to be great to start, but you have to start to be great. ~Zig Ziglar
Skills
The skills below represent my capabilities and the experience that I bring to the workplace. They reflect both the technical tools I use and the analytical and collaborative strengths I bring to every project.


Excel | Tableau | Power BI | SQL
Technical/Data Skills
Data Cleaning & Transformation
SQL Queries
Excel (Pivot Tables & Reports)
Dashboard Development
Data Visualization & Storytelling
Data Validation & Quality Checks
Analytical/Professional Skills
Problem Solving & Critical Thinking
Business Case Development
Data-Driven Analysis
Presentation Design
Communication of Insights
Collaboration & Teamwork
Featured Projects
From messy data to clear conclusions - these projects demonstrate my approach to data analysis: asking meaningful questions, identifying trends and patterns, and delivering insights that create actionable business solutions.

E-Commerce Customer Behavior Analysis
Tableau Dashboard
This dashboard analyzes customer behavior by exploring how purchasing behavior, revenue trends, and satisfaction metrics influence business outcomes.

Luxury Retail Sales Analysis
Tableau Dashboard
A Tableau dashboard analyzing luxury retail data across categories, stores, and products to uncover profitability trends and margin drivers.

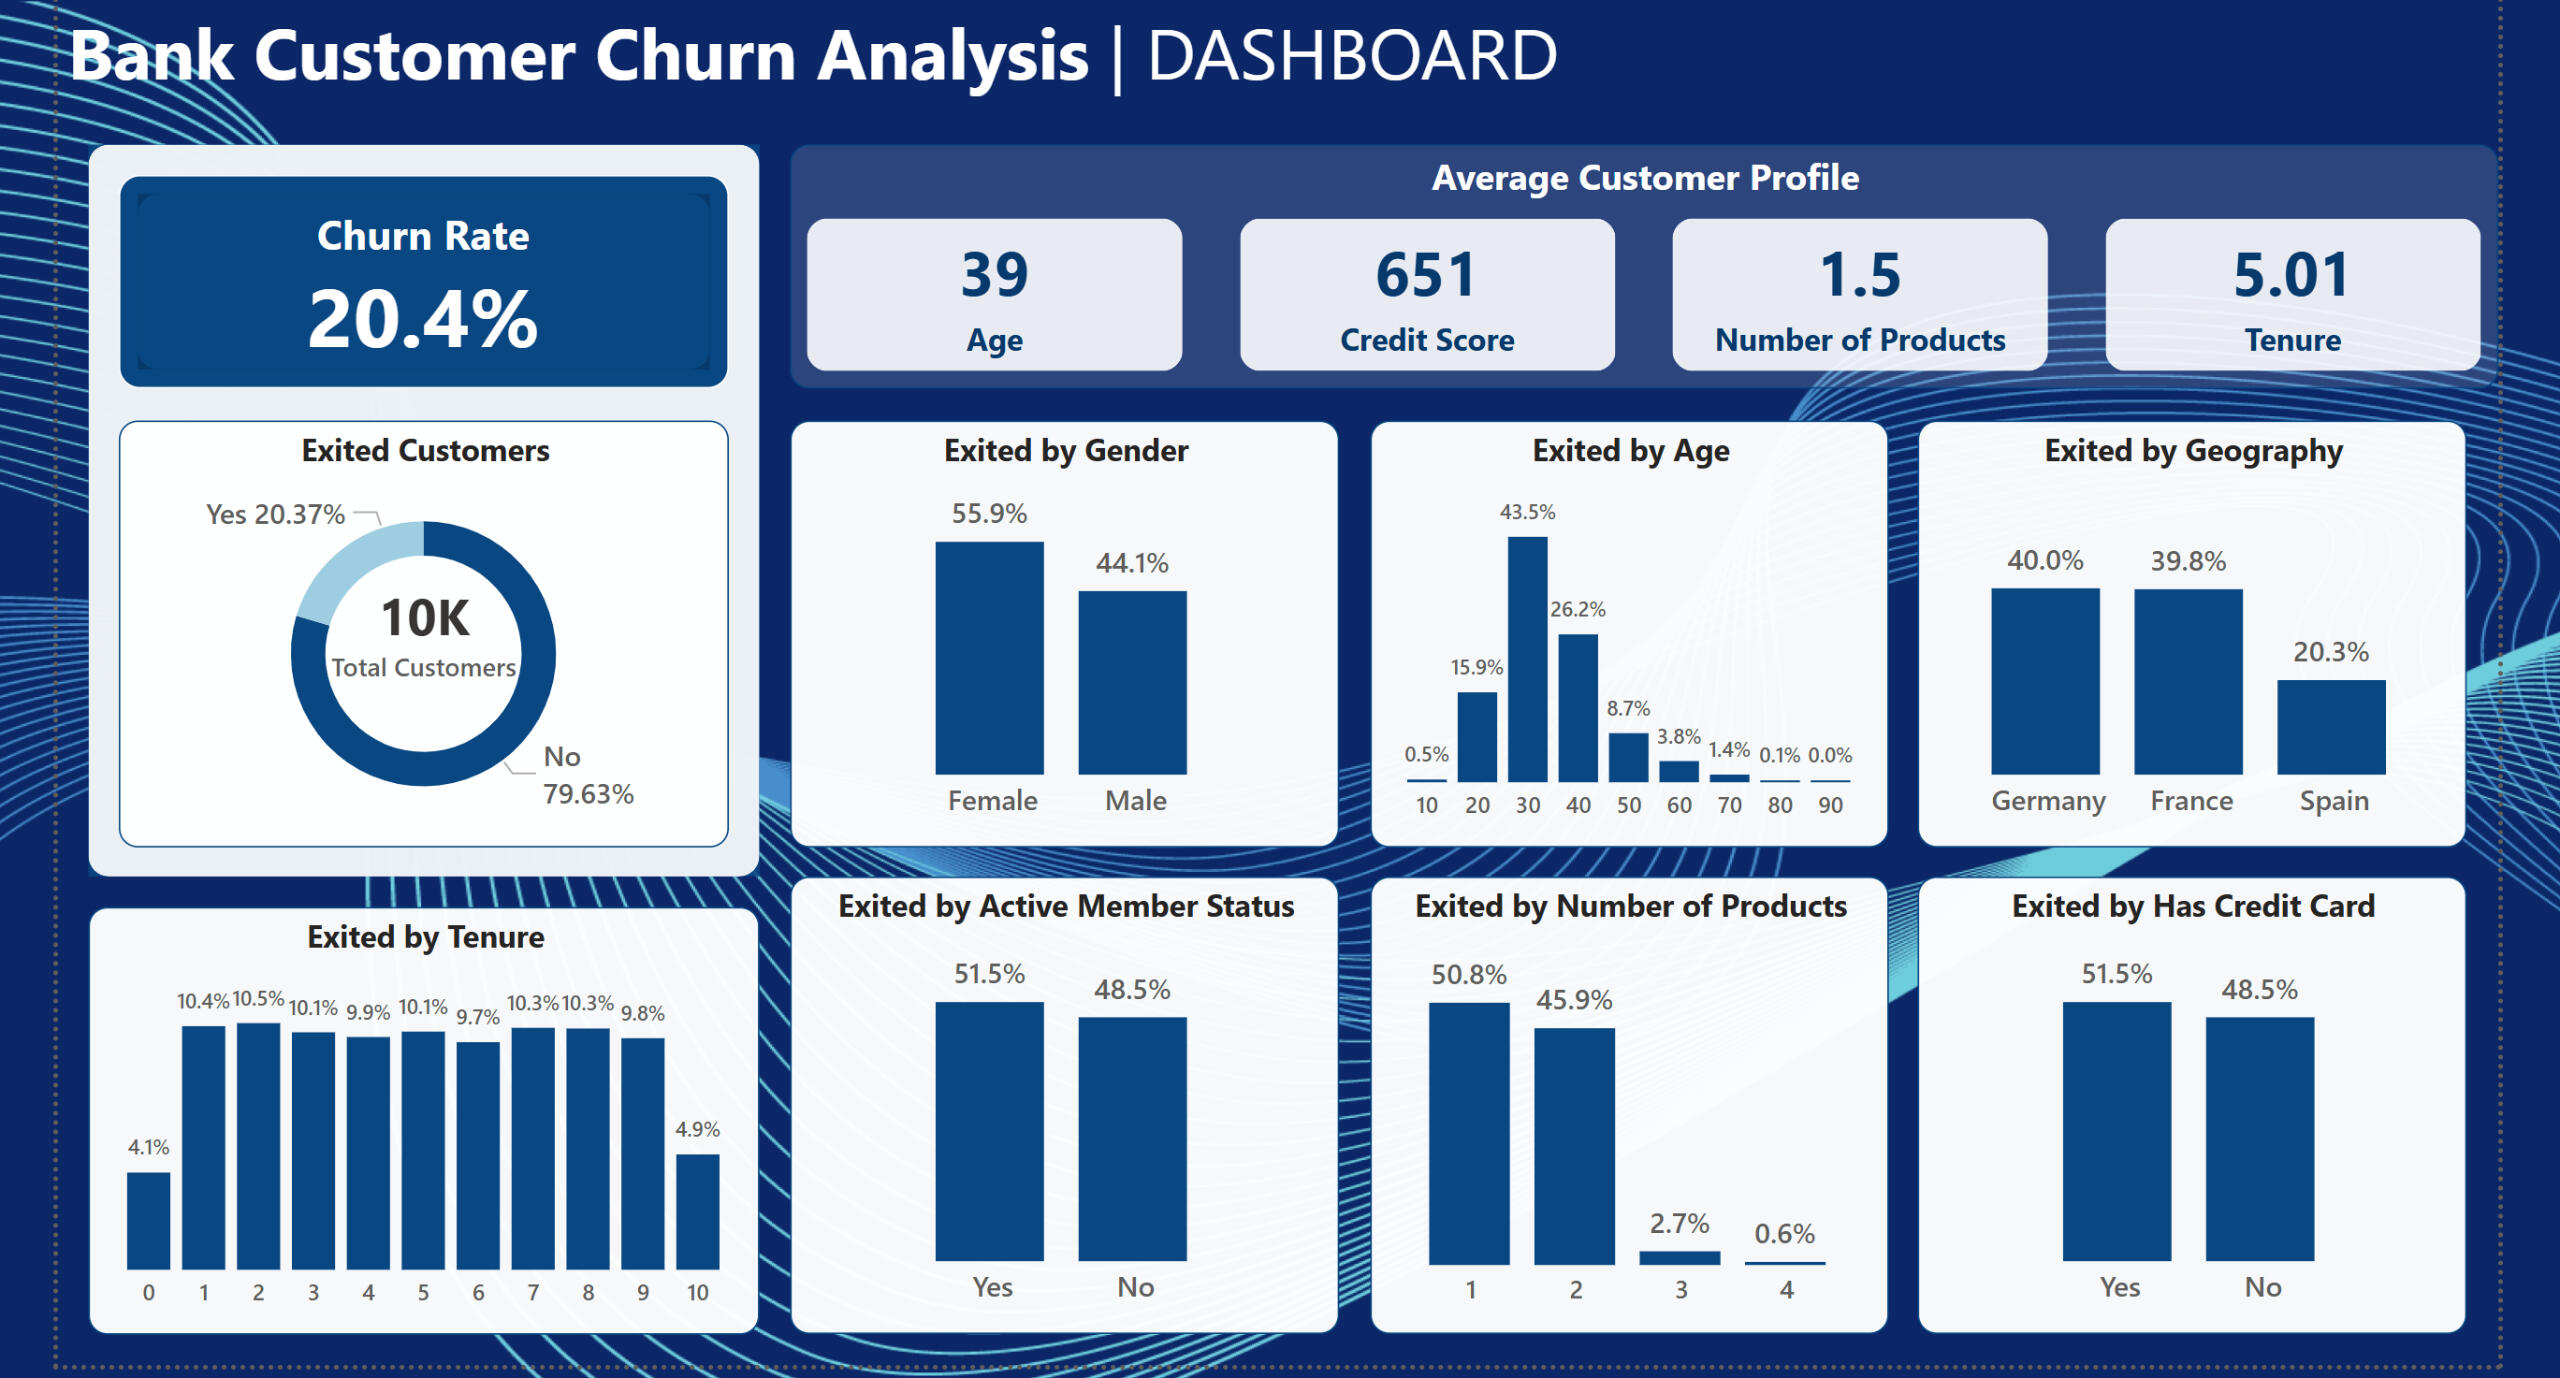
Bank Churn Analysis
Power BI Dashboard/ Business Case
An interactive dashboard and business case exploring customer churn patterns, identifying at-risk clients, and providing actionable business solutions.

Bank Churn Analysis
Stakeholder Presentation
A PowerPoint presentation summarizing customer churn analysis data and presenting a practical plan to reduce customer loss.

Freelancer Analysis
SQL Project
Real business questions applied to freelancer data, demonstrating SQL queries from basic to advanced with documented results for each.
Professional Certifications

Google Data Analytics Professional Certificate
Microsoft MTA: Database Fundamentals in SQL
SQL Project - Freelancer Analysis
This project demonstrates my SQL skills through an analysis of freelancer industry trends. I've structured the analysis around real-world business questions, from basic data exploration to advanced analytical techniques. Each query is presented alongside its results to show the technical approach and the insights uncovered.
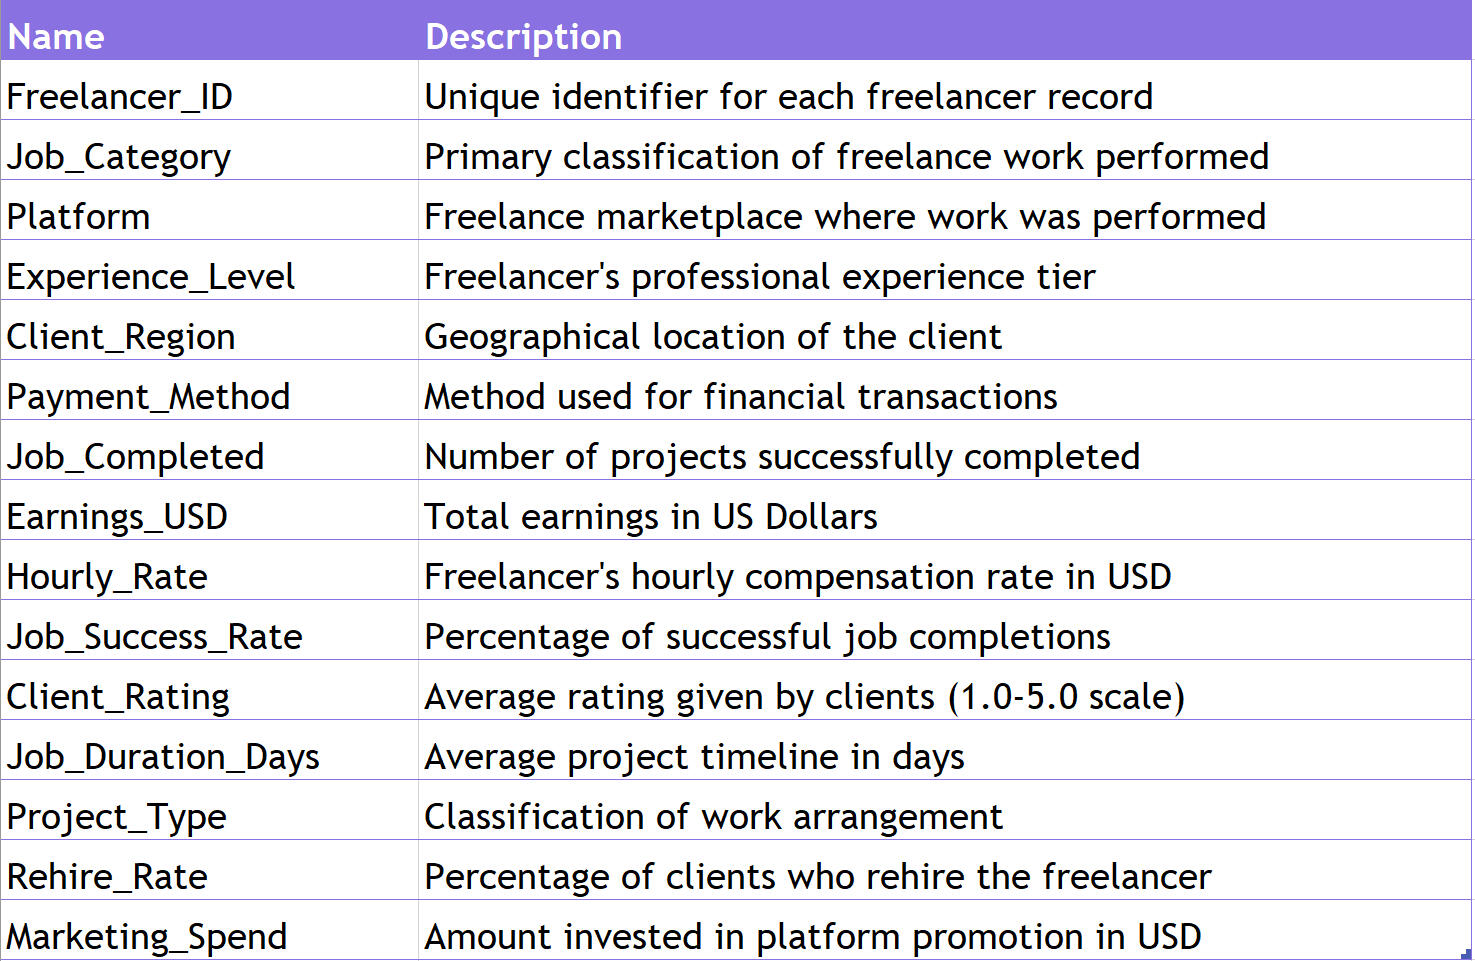
Data Dictionary
Queries
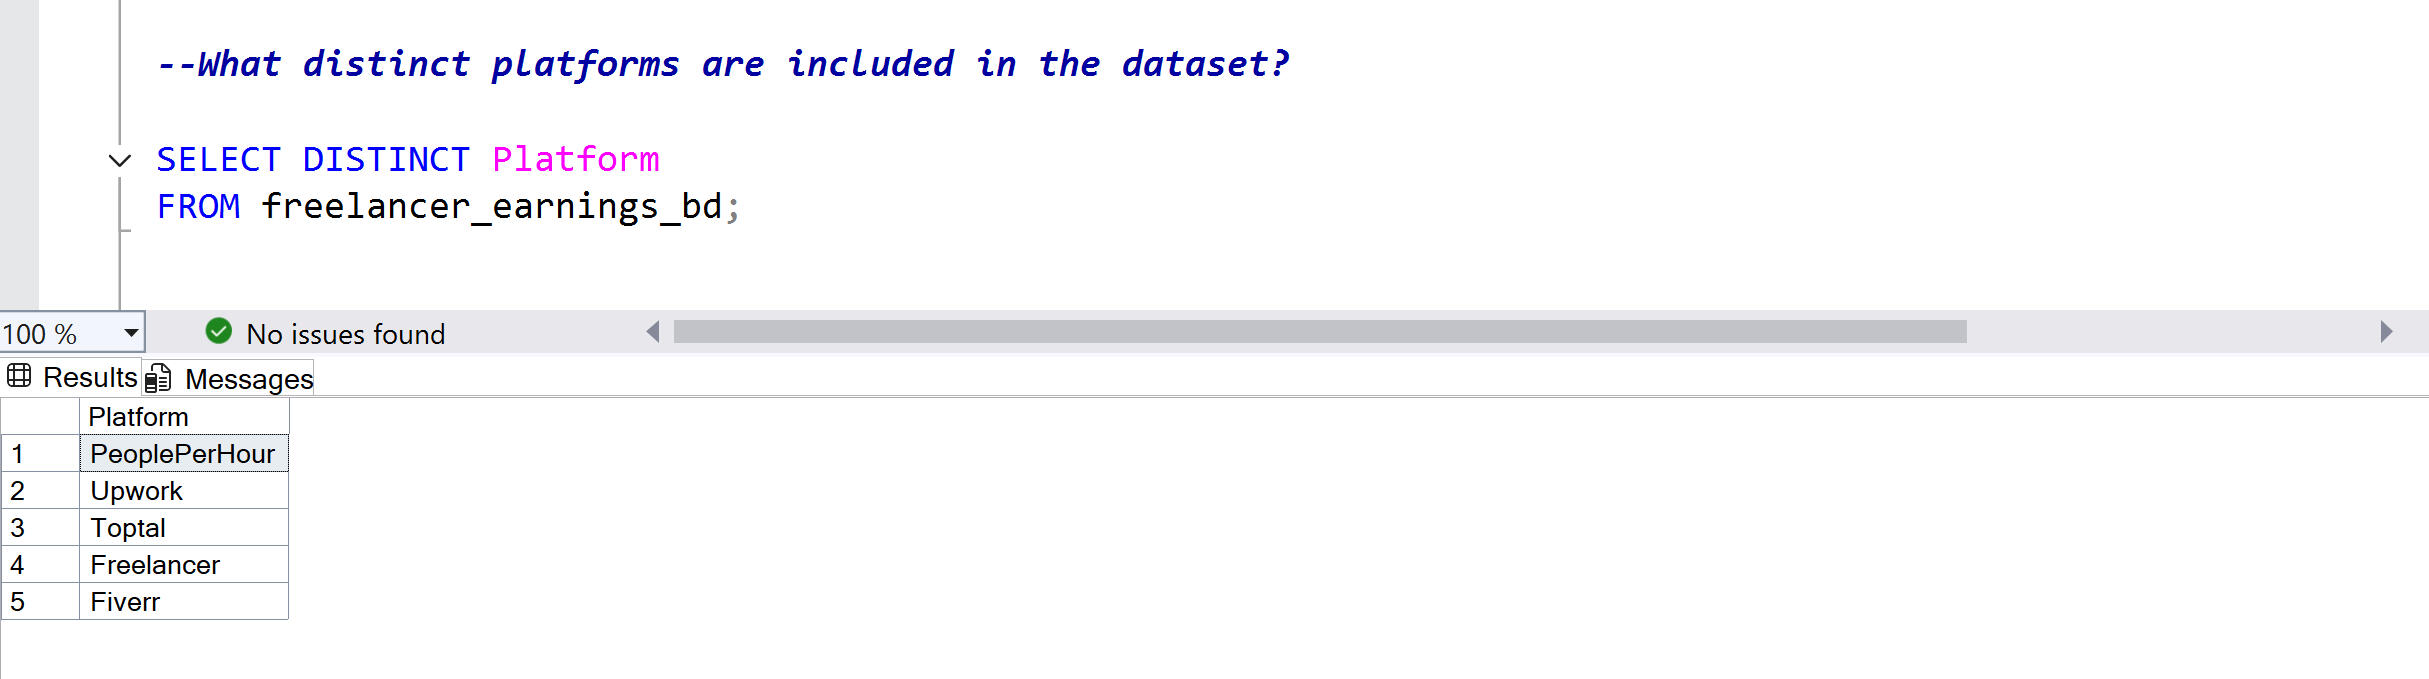
1. Identifying Unique Platforms in the Data
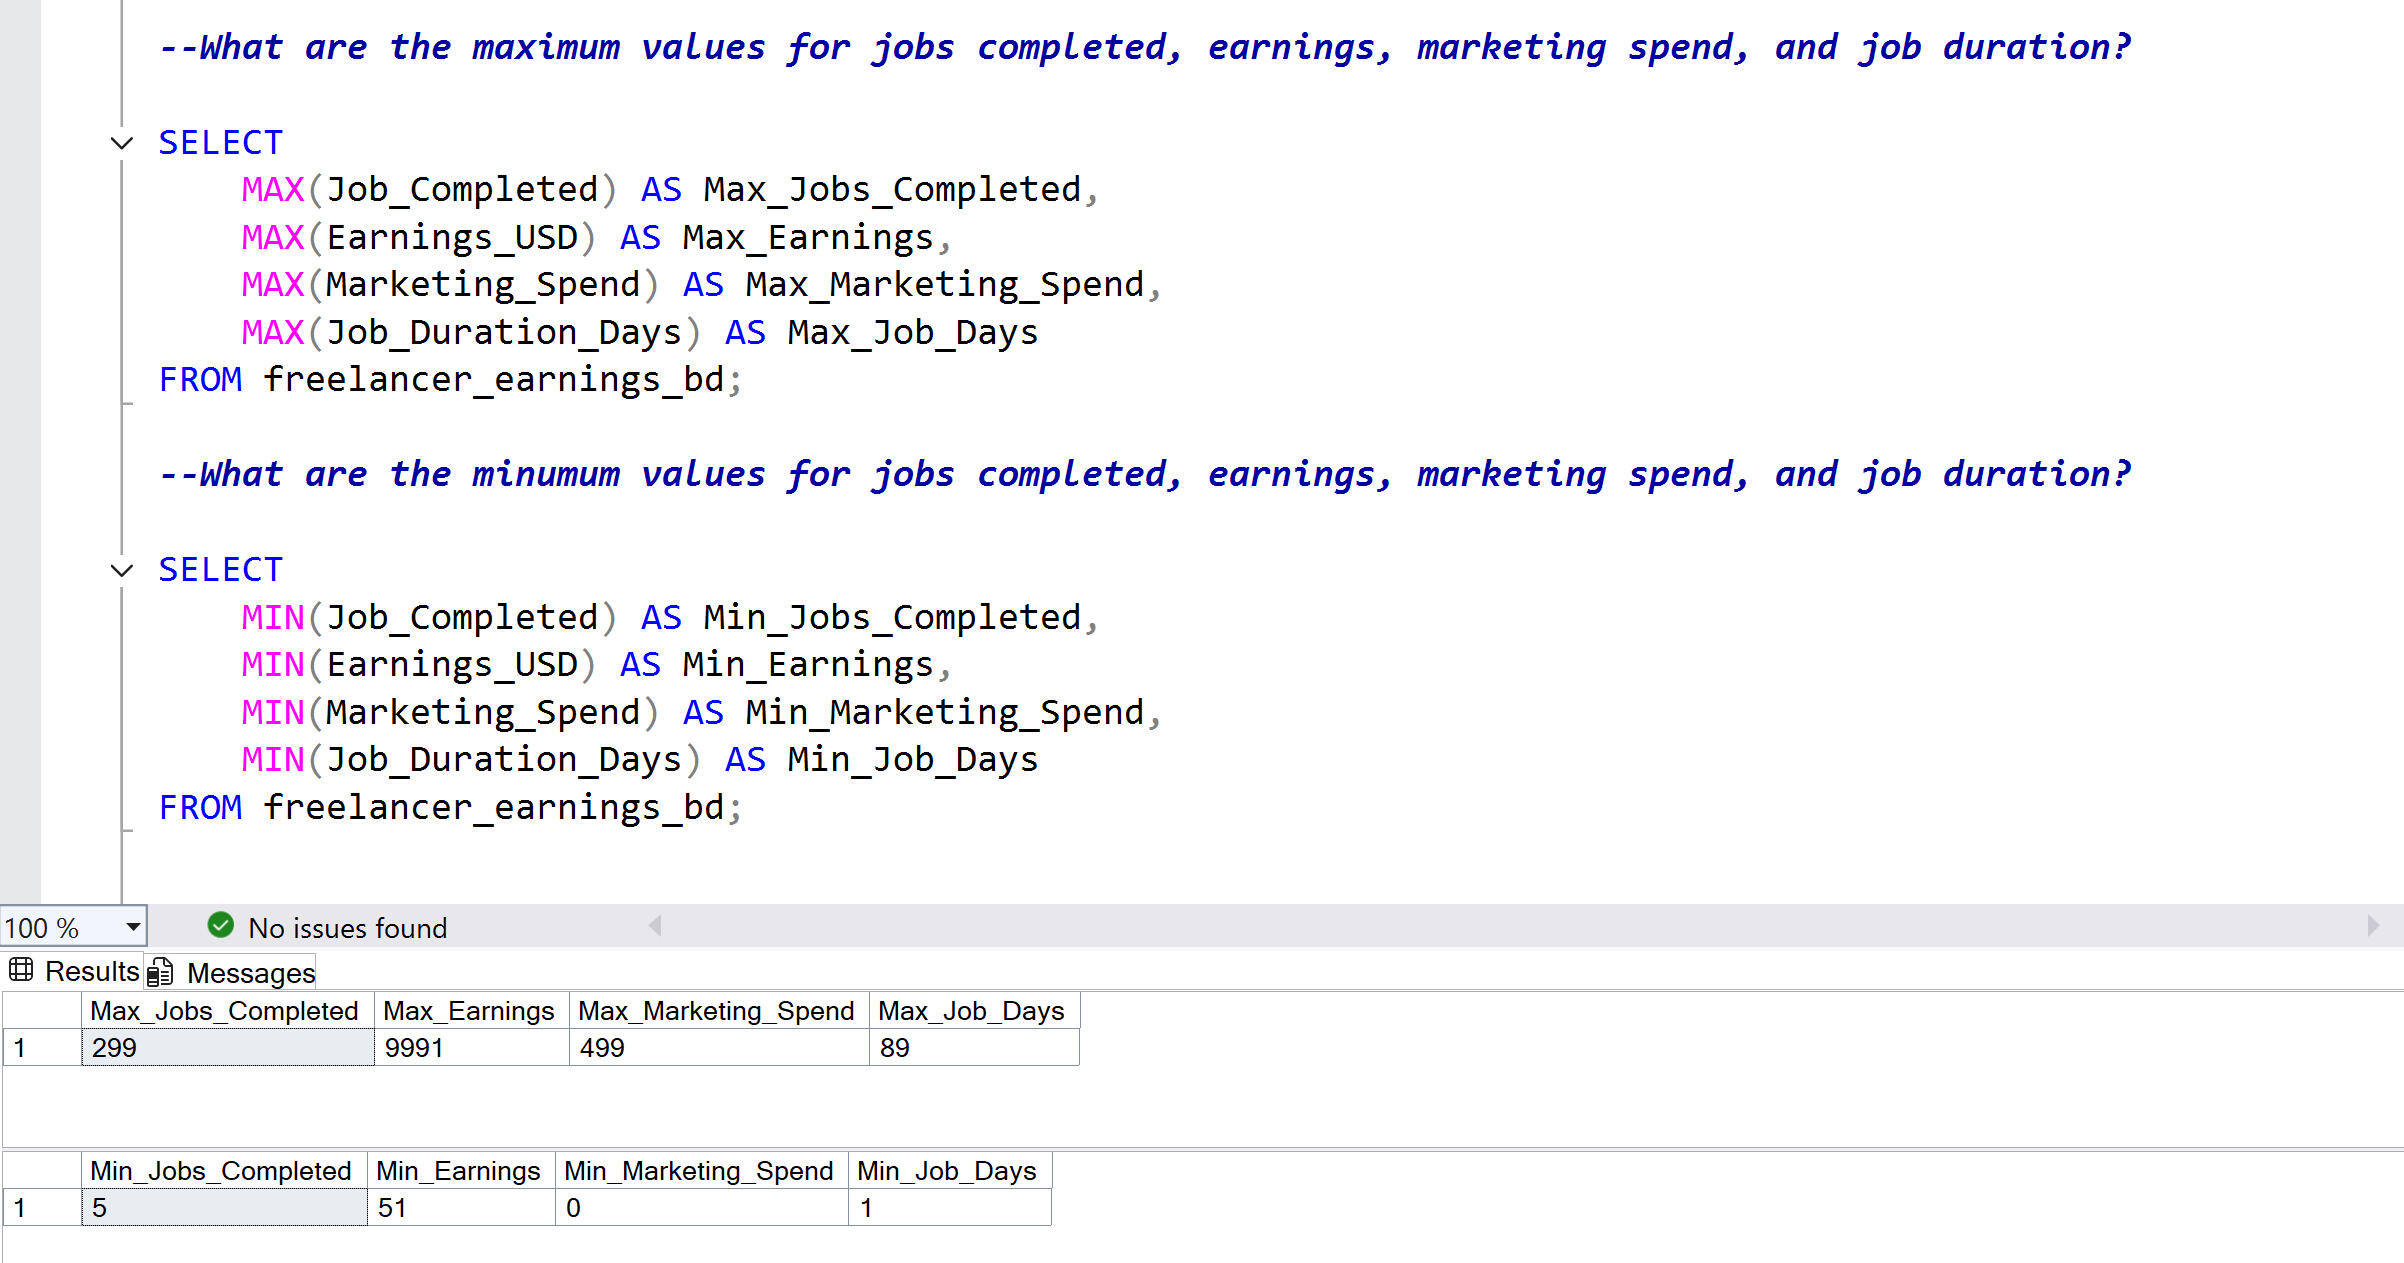
2. Minimum and Maximum Values by Categories
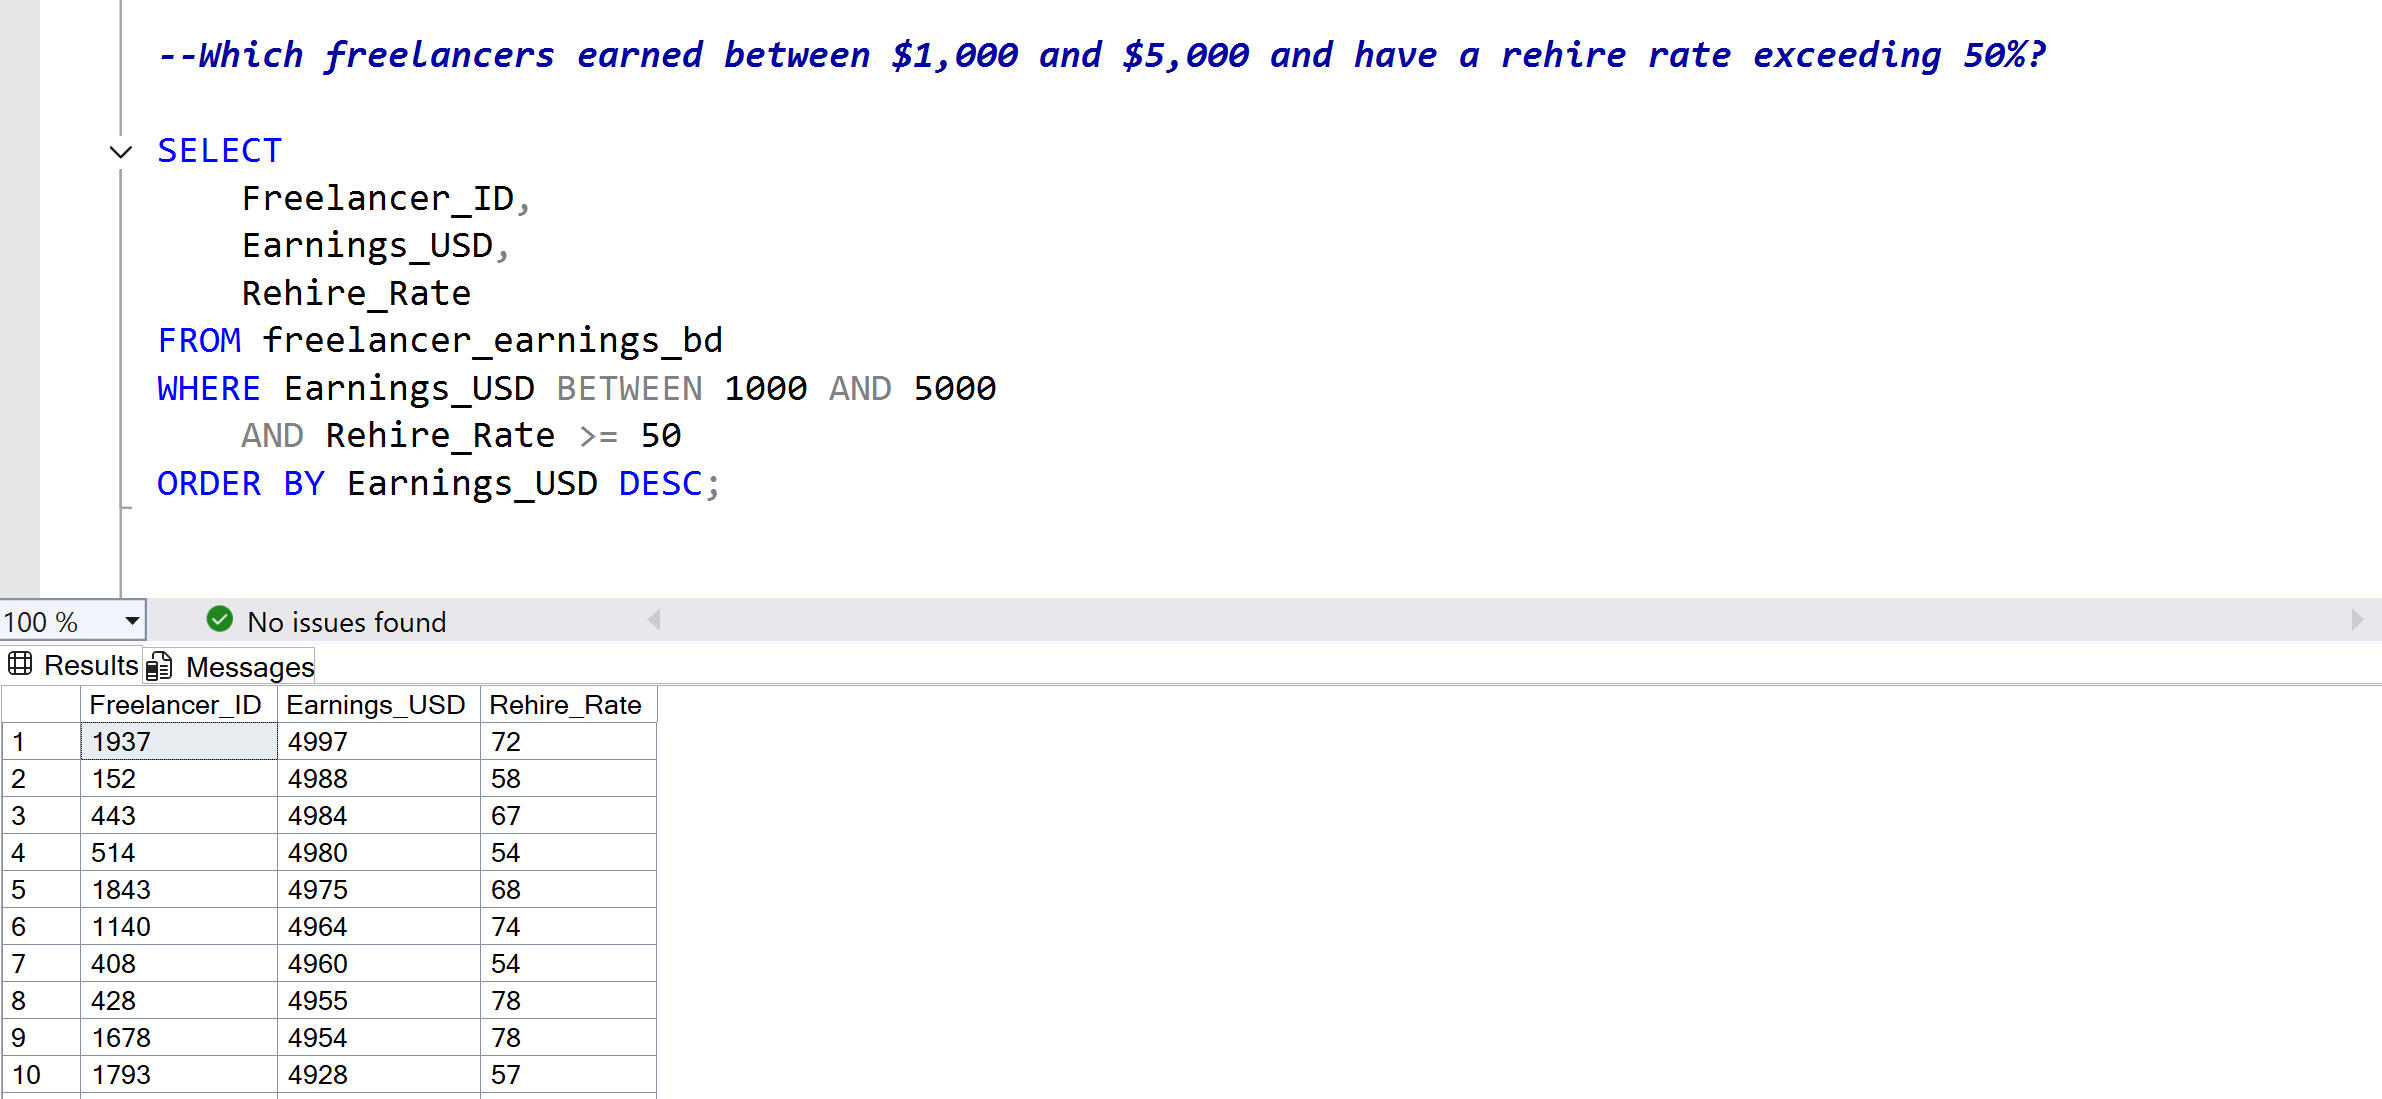
3. Freelancers Earning Between $1000-$5000 with Rehire Rates Above 50%
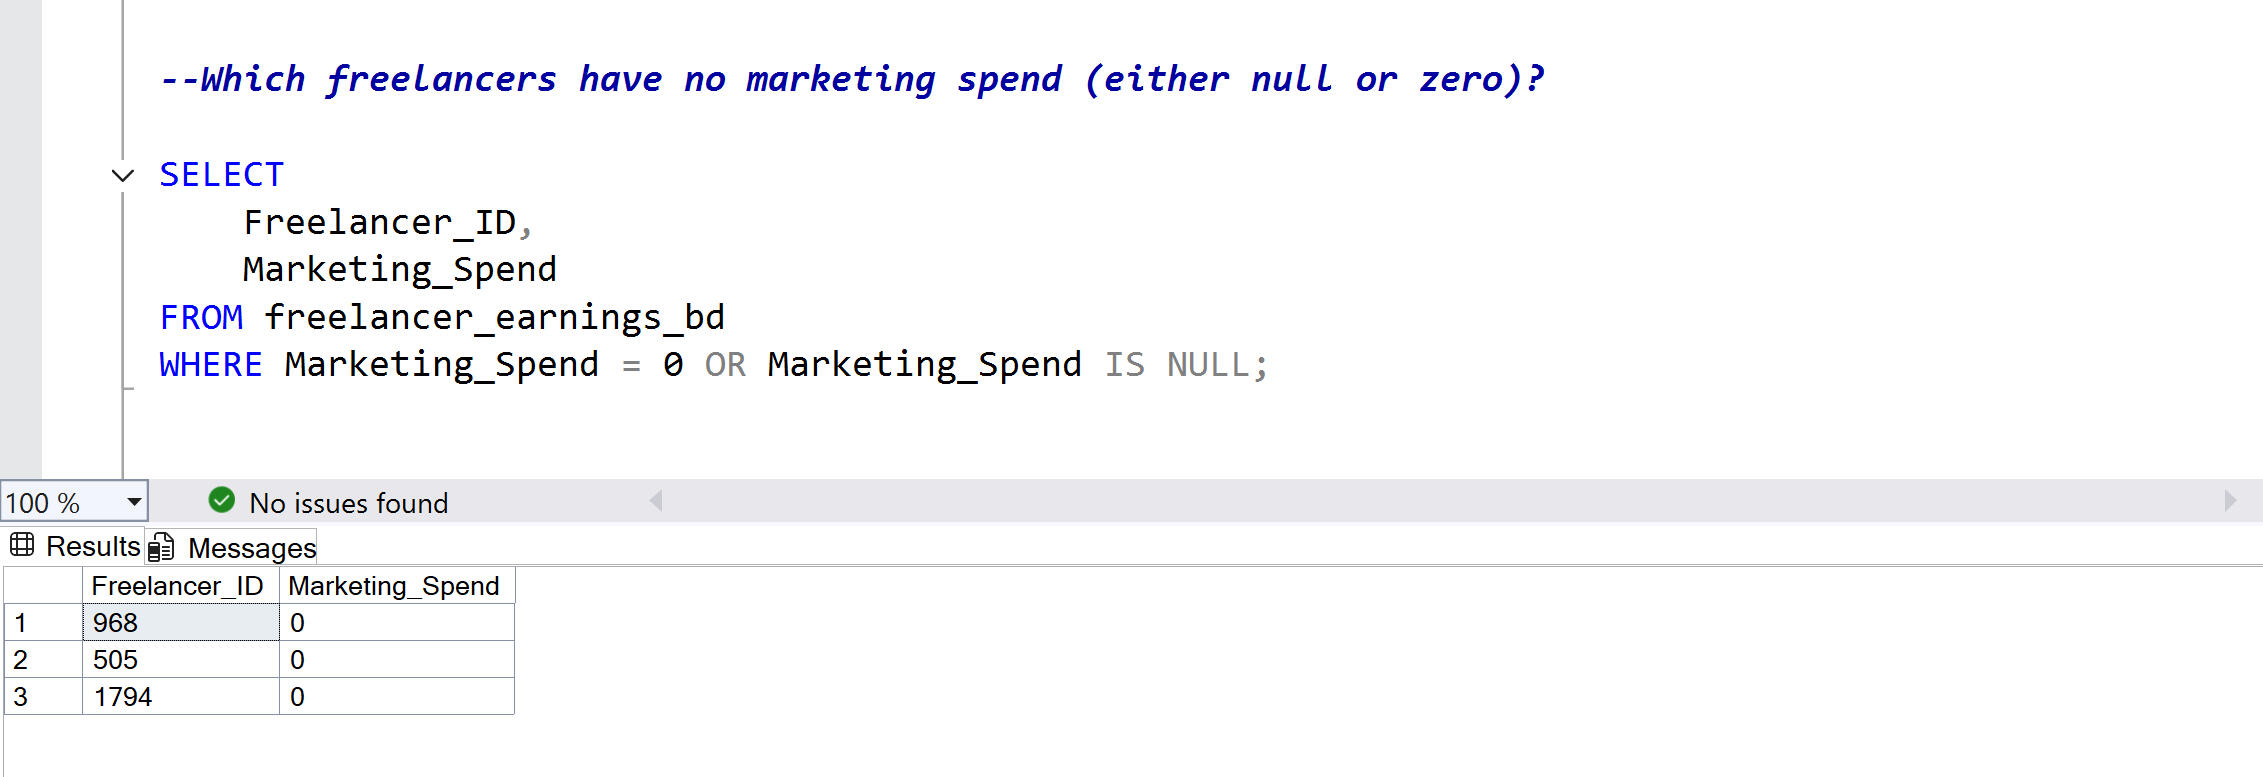
4. Freelancers spending Zero Dollars on Marketing
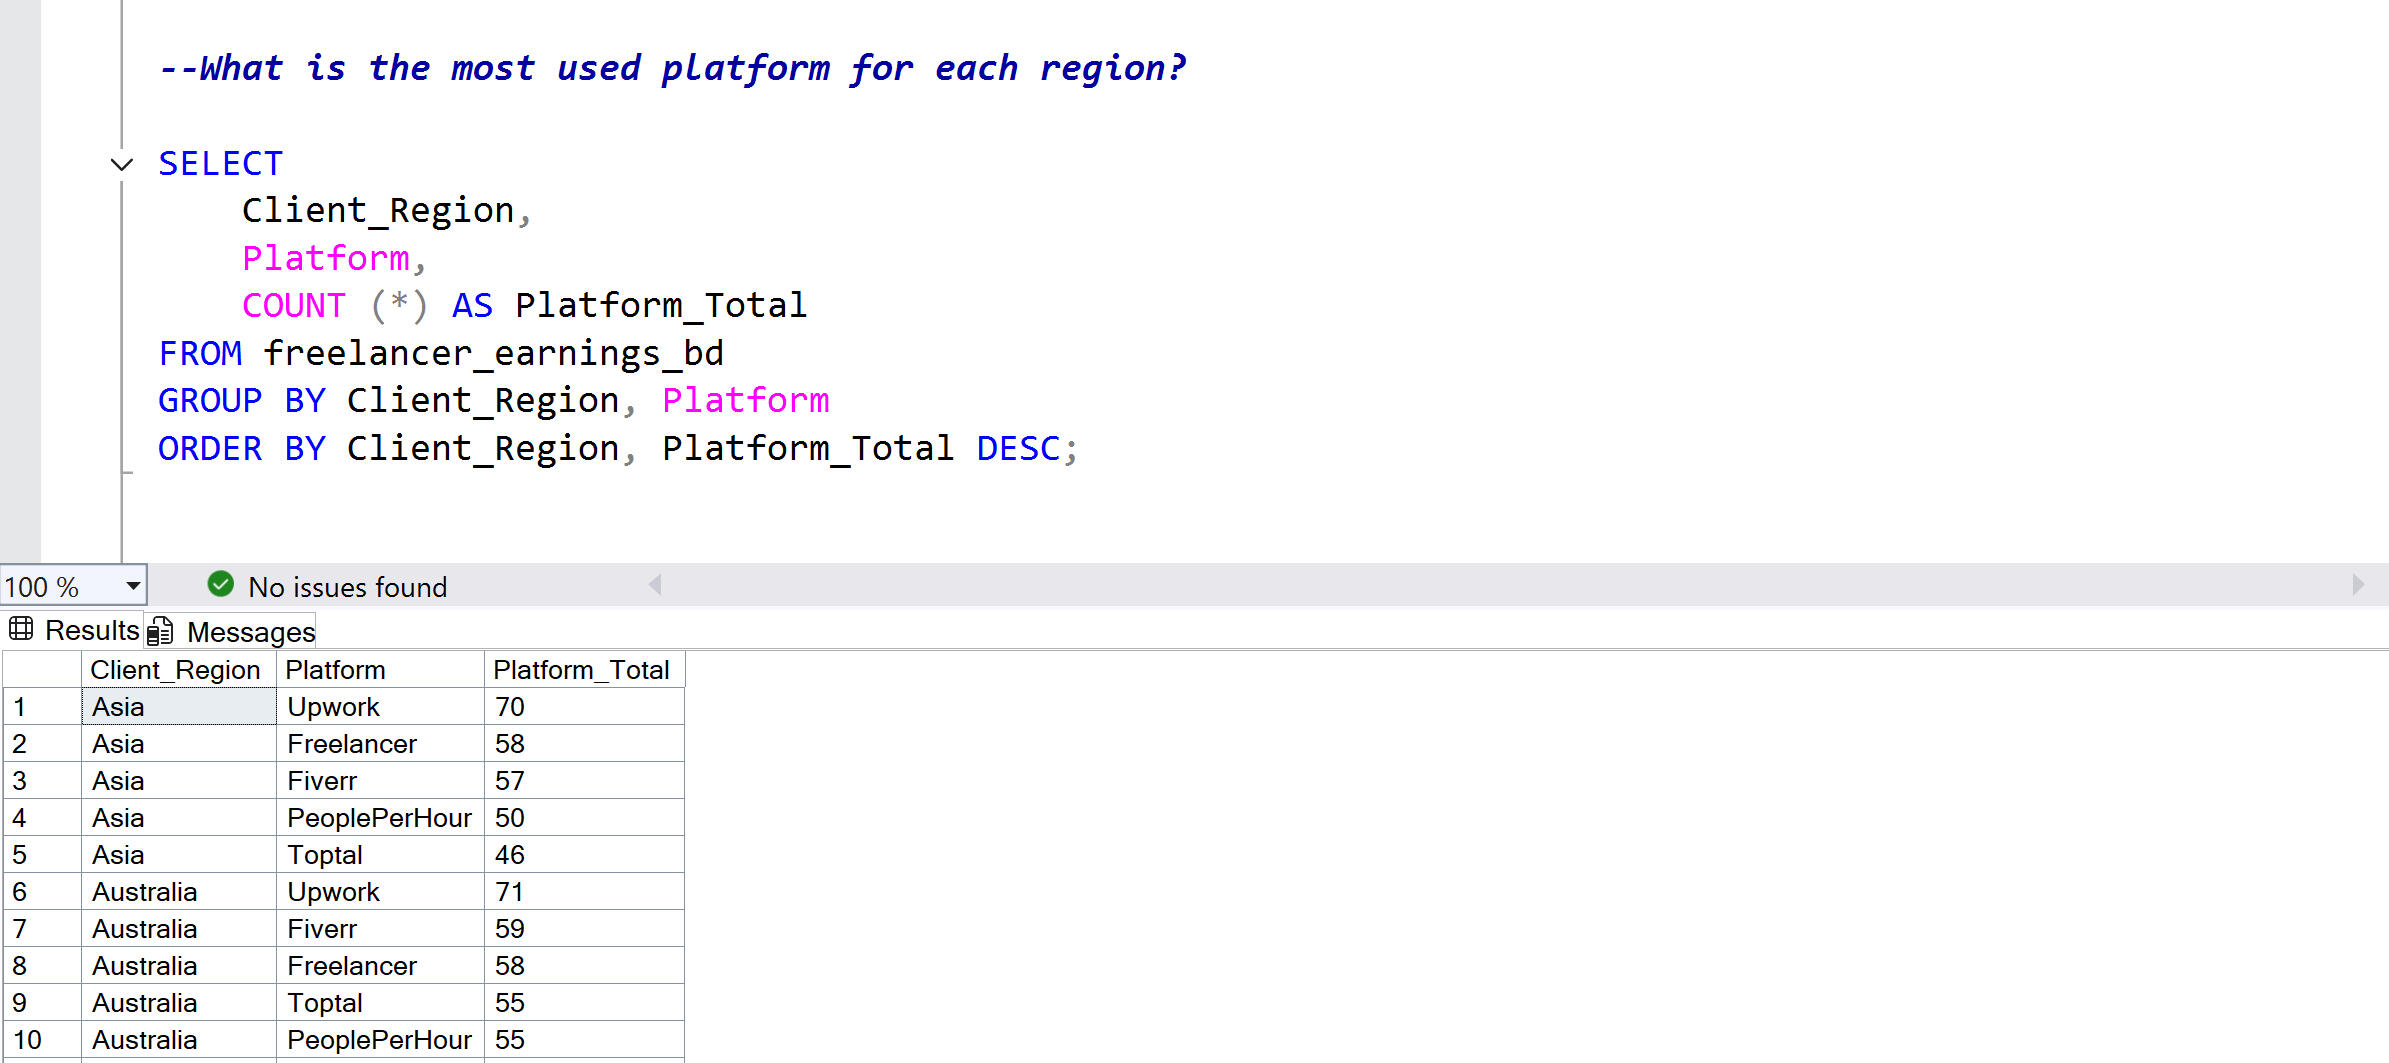
5. Most Used Platform by Region
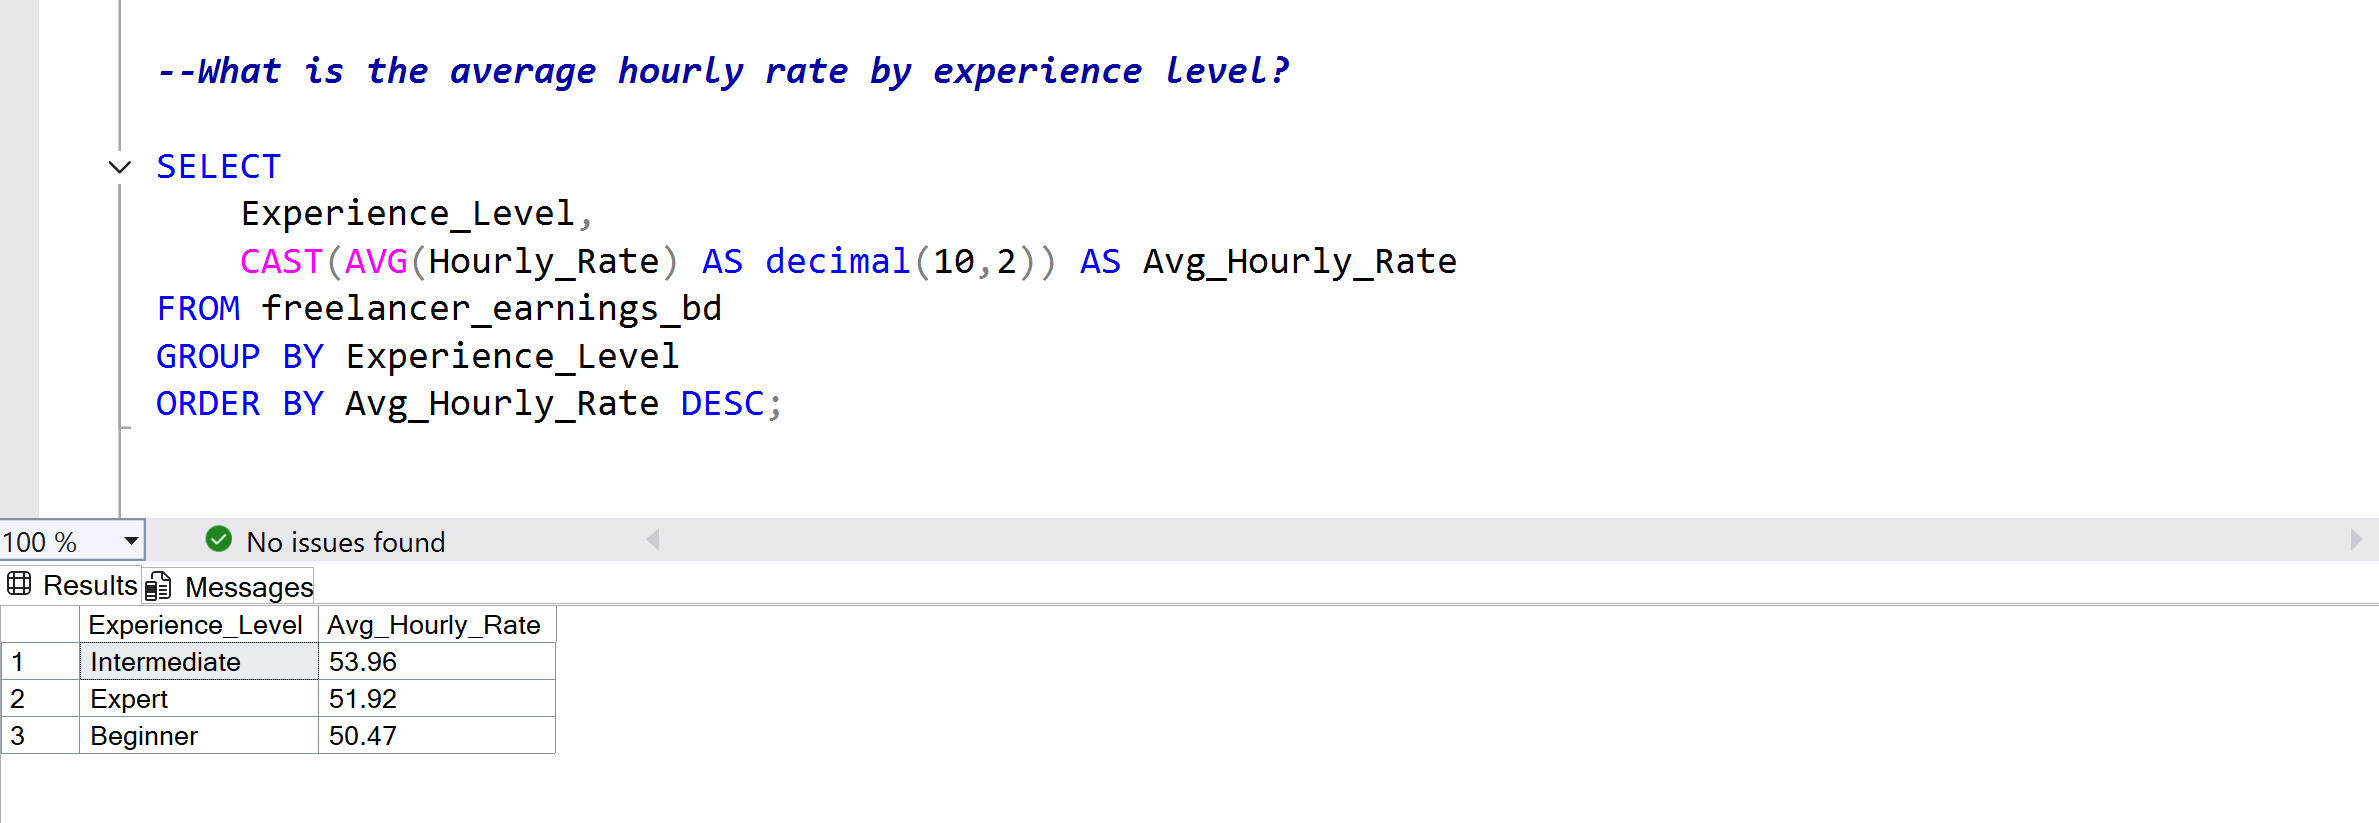
6. Average Hourly Rate by Experience
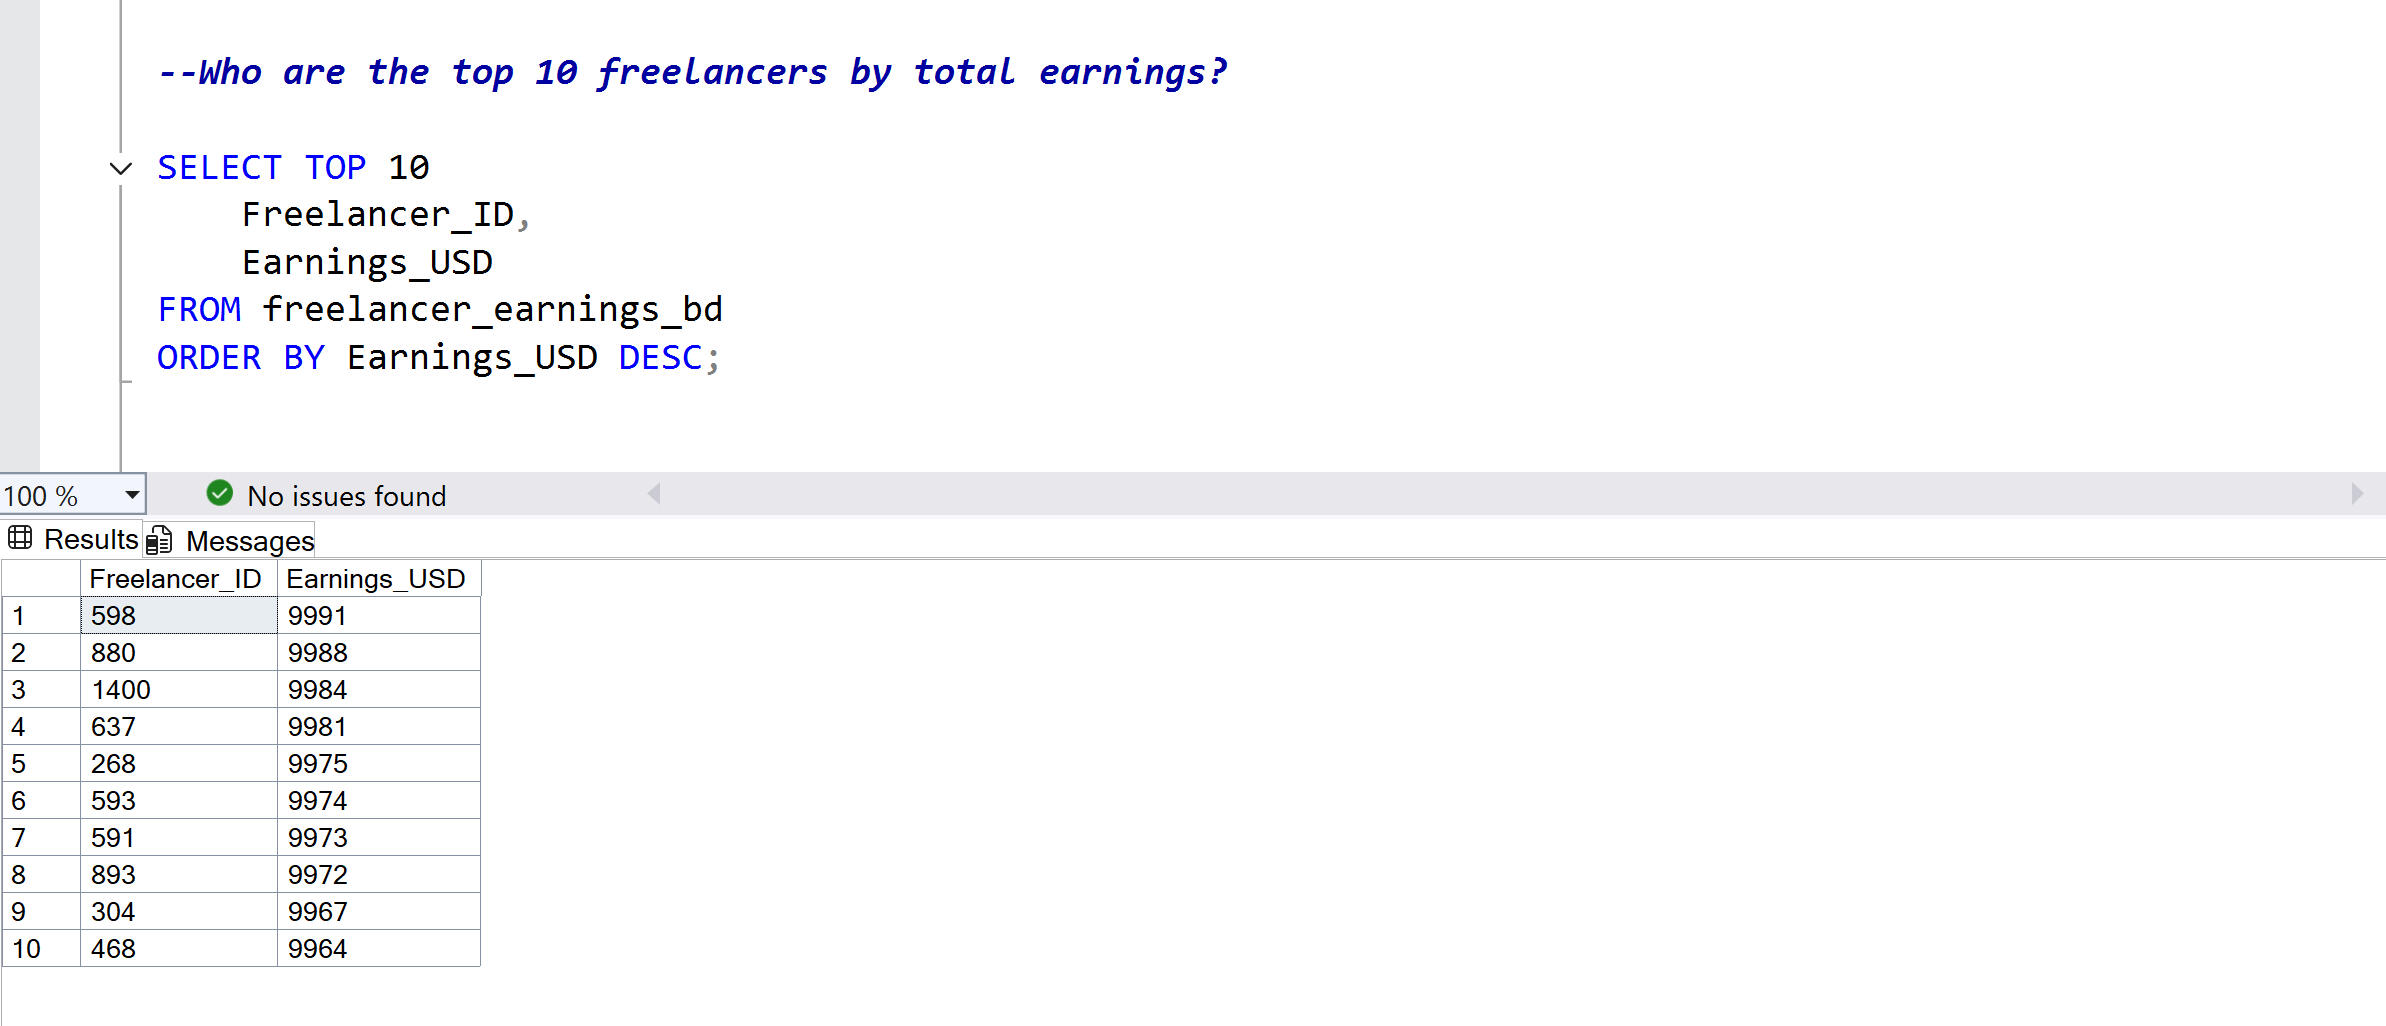
7. Top 10 Freelancers by Earnings
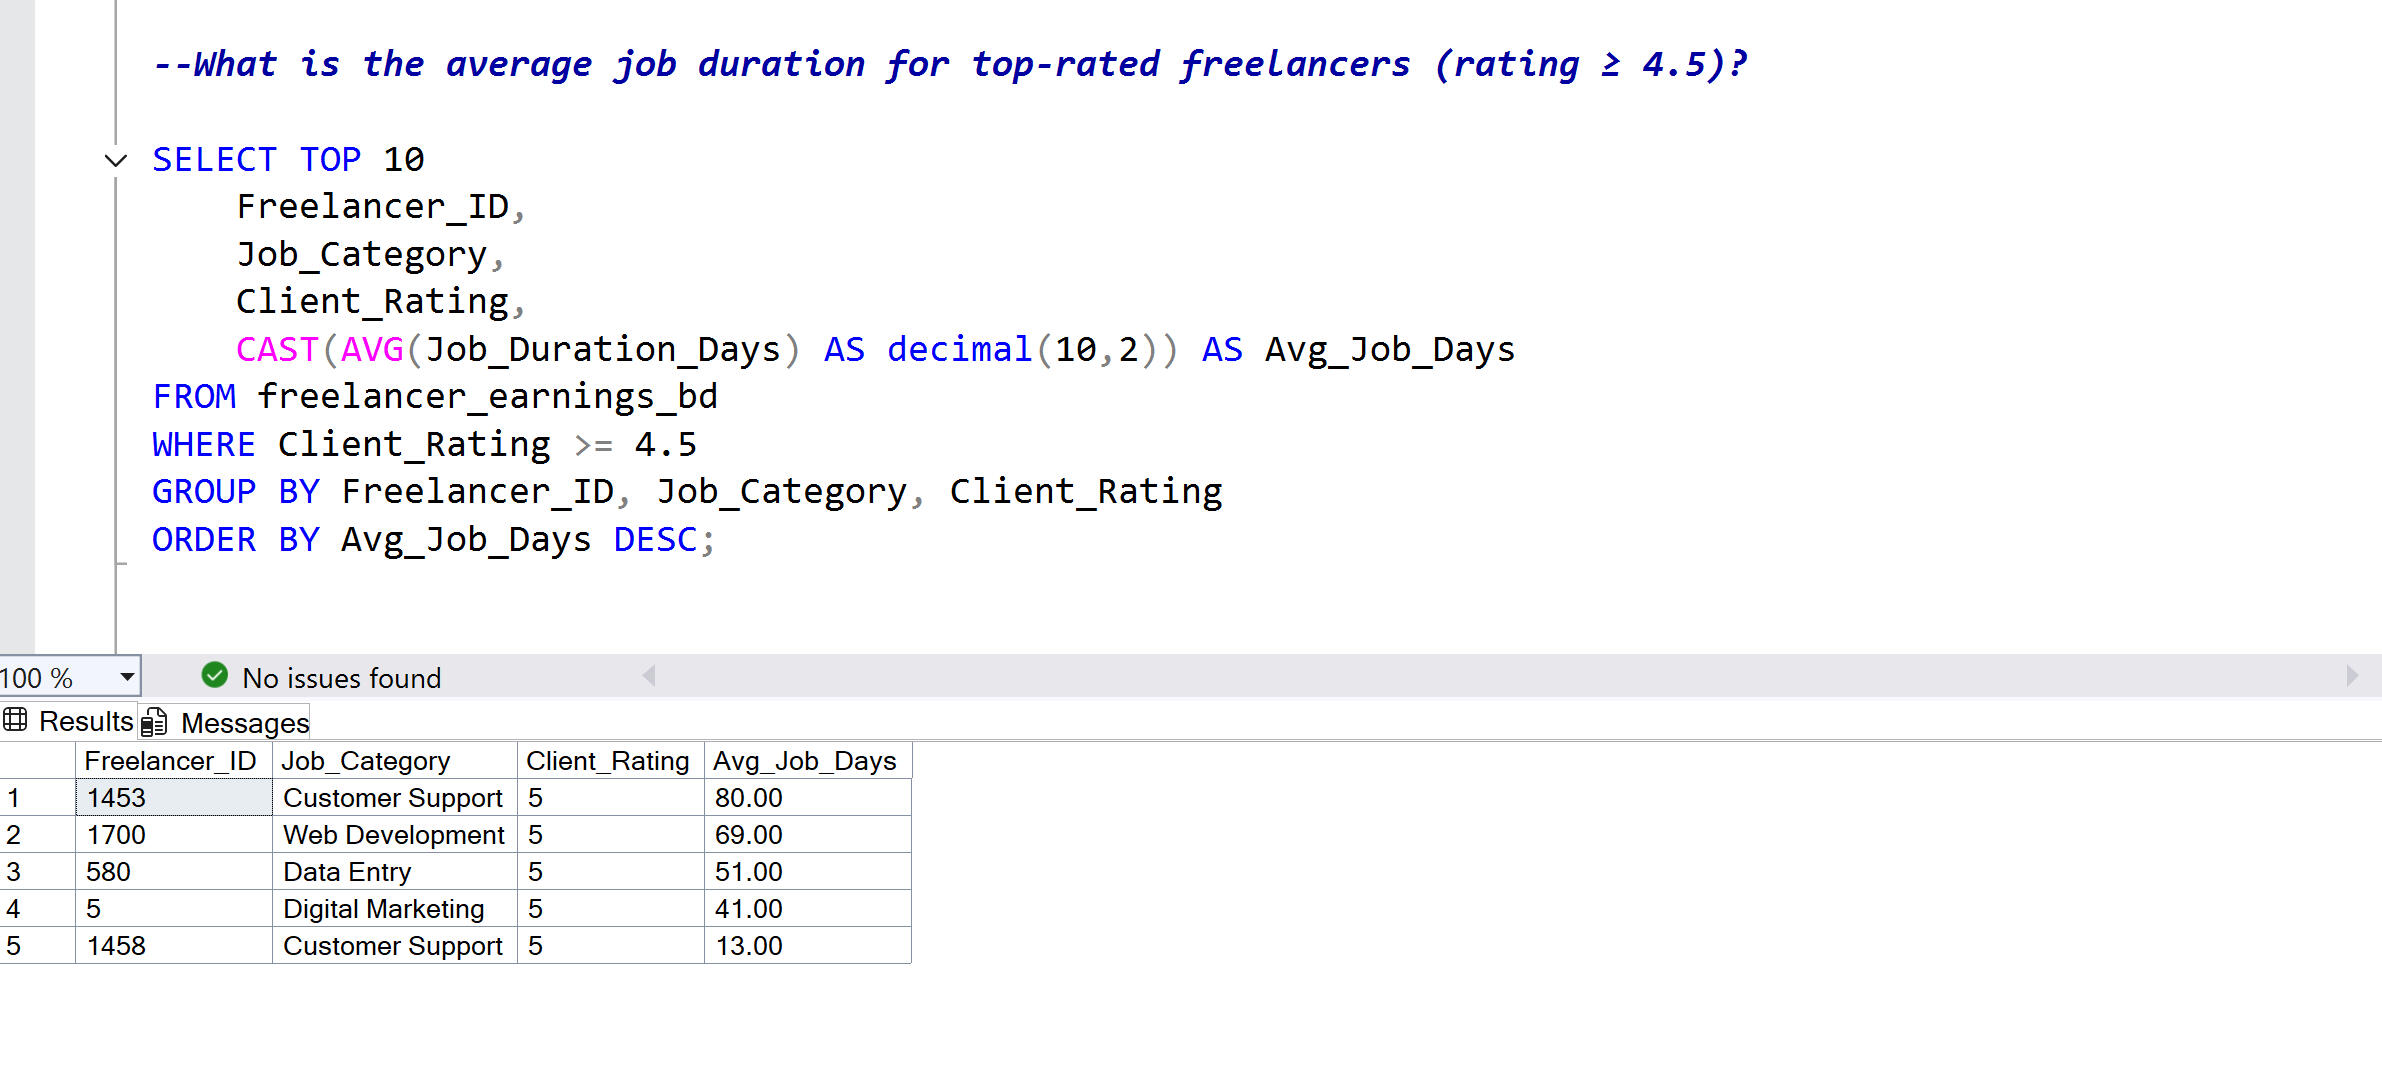
8. Average Job Duration for Freelancers Rating 4.5 and Above
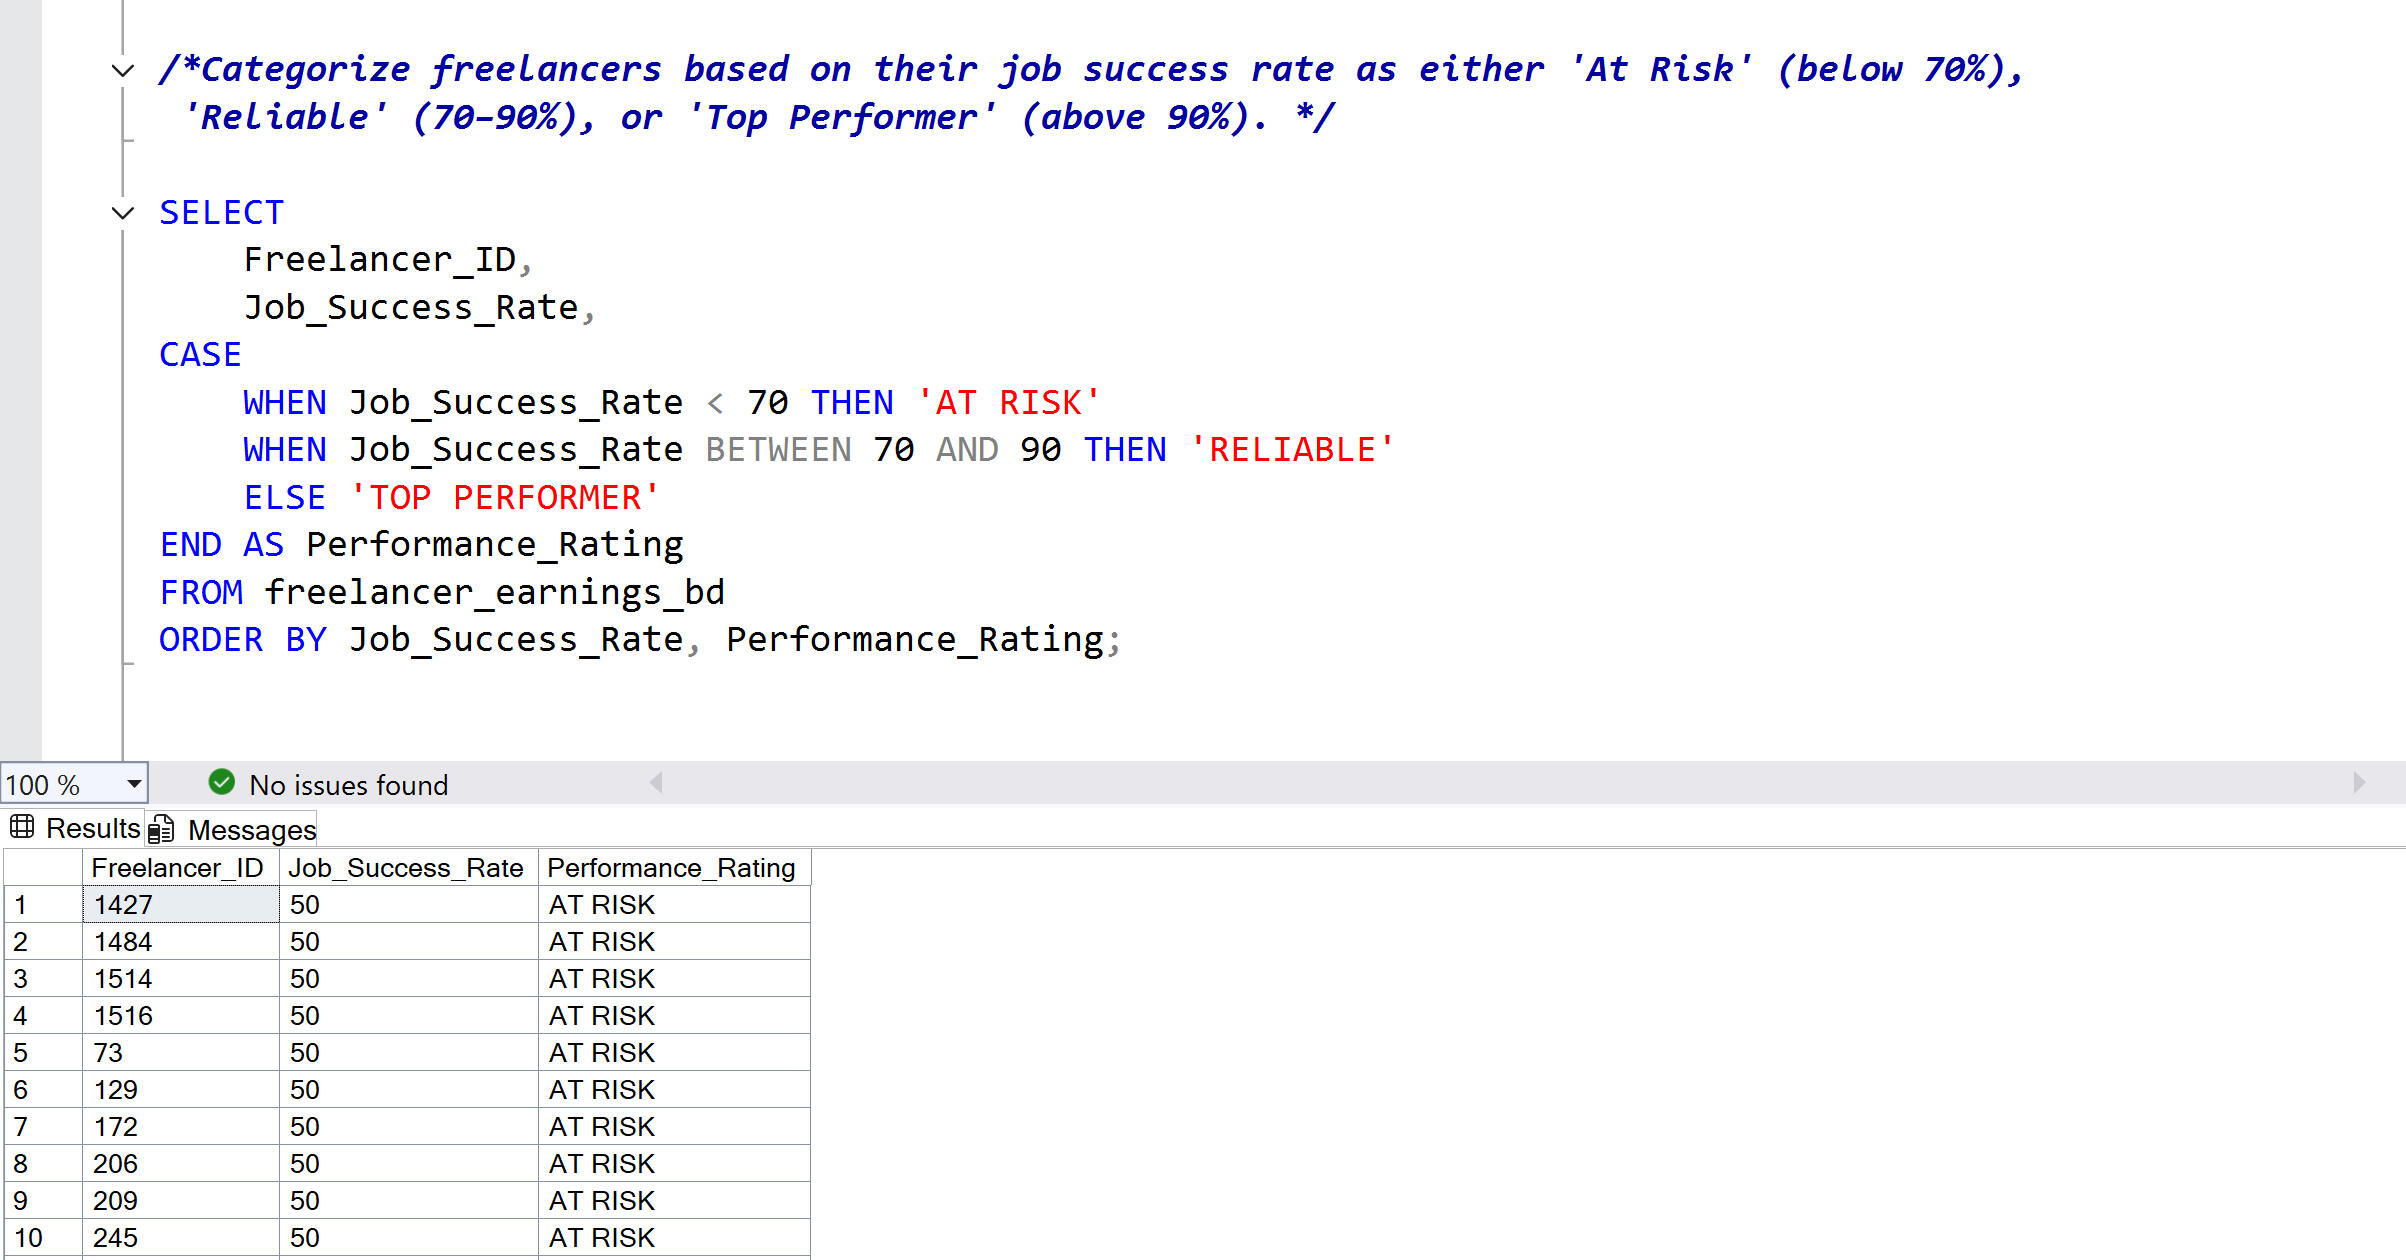
9. Categorize Freelancers Based on Job Success Rate
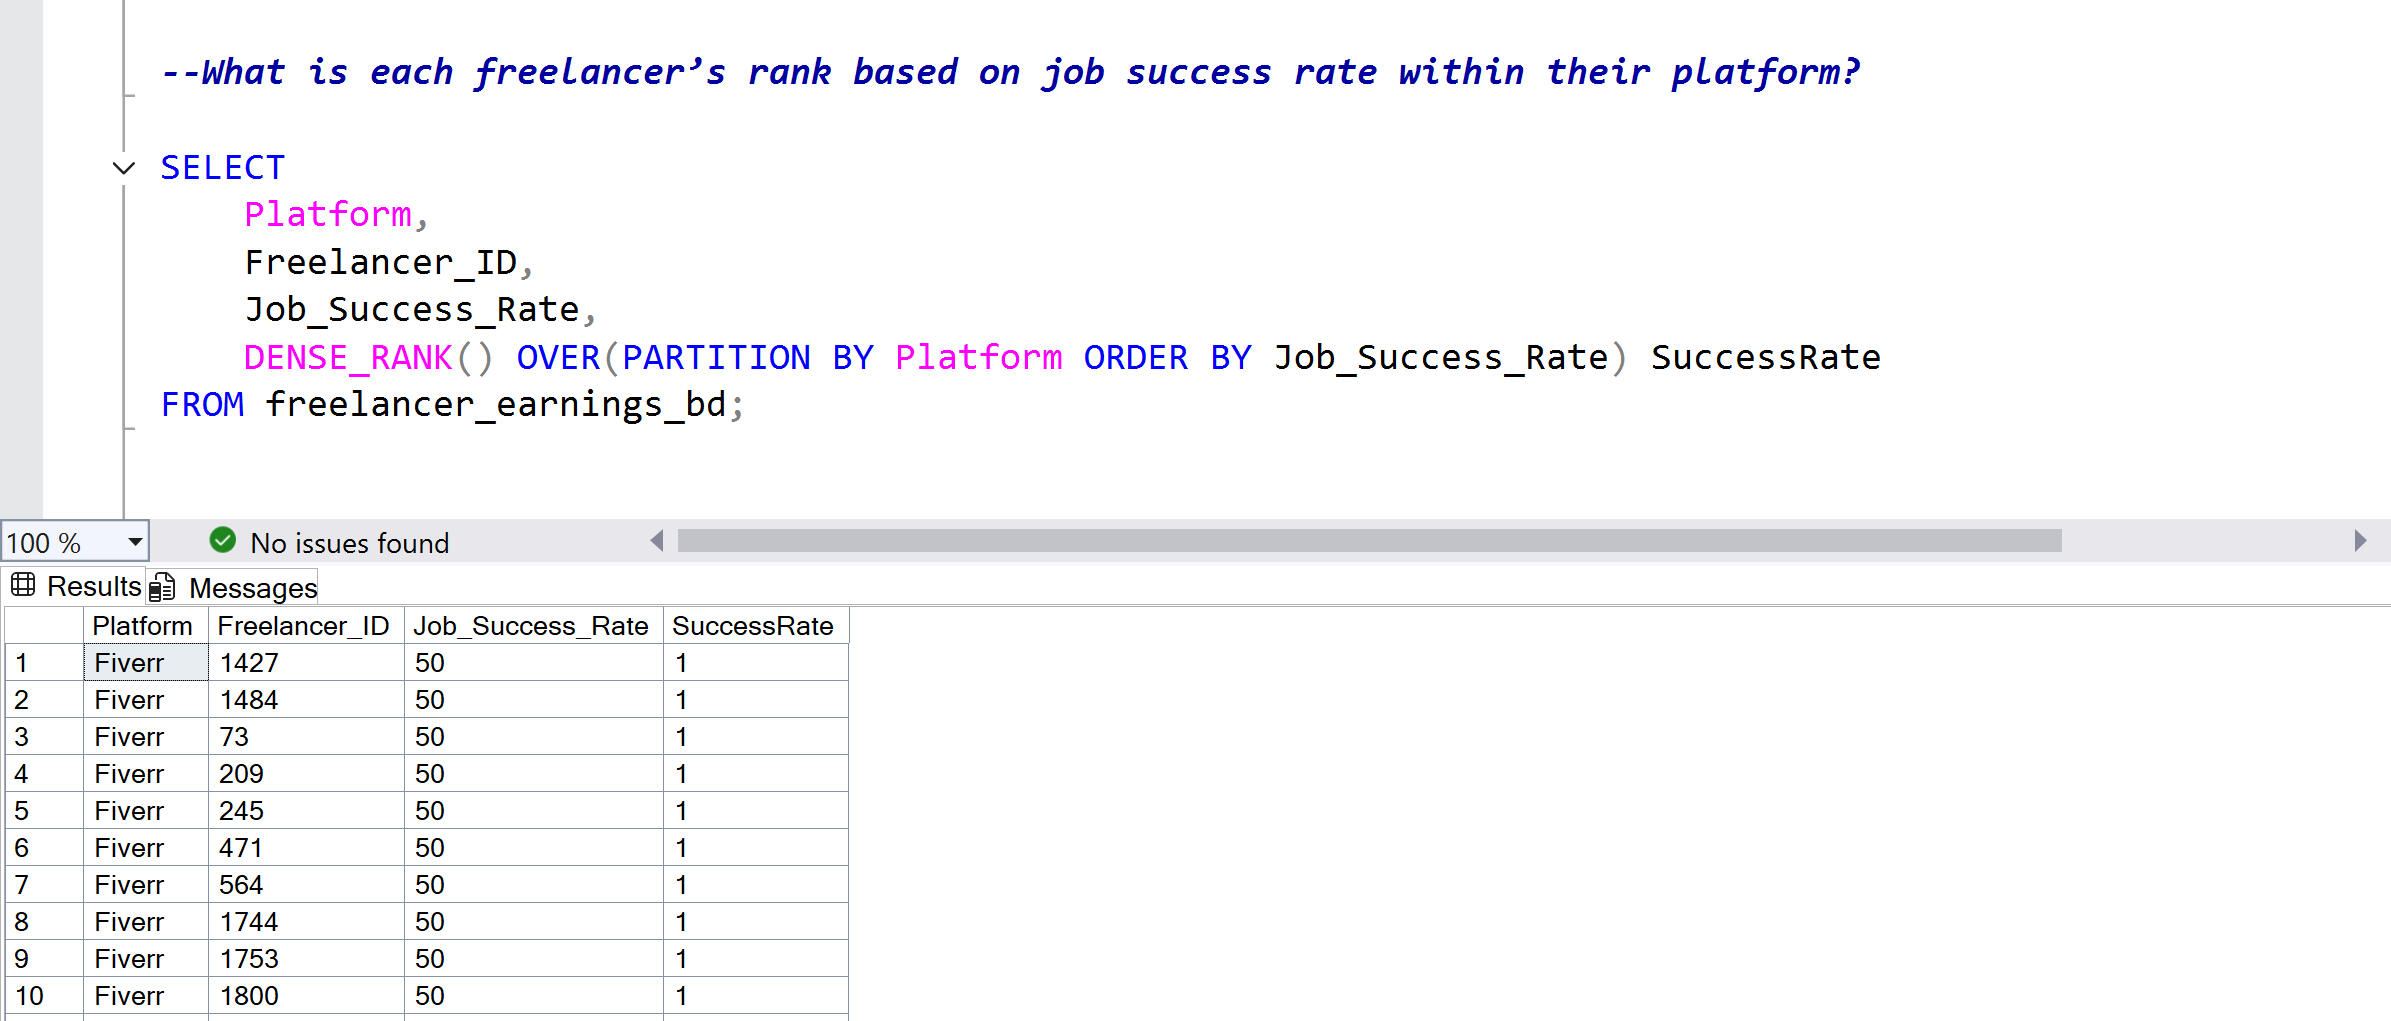
10. Freelancers Ranked by Success Rate Within Their Platform
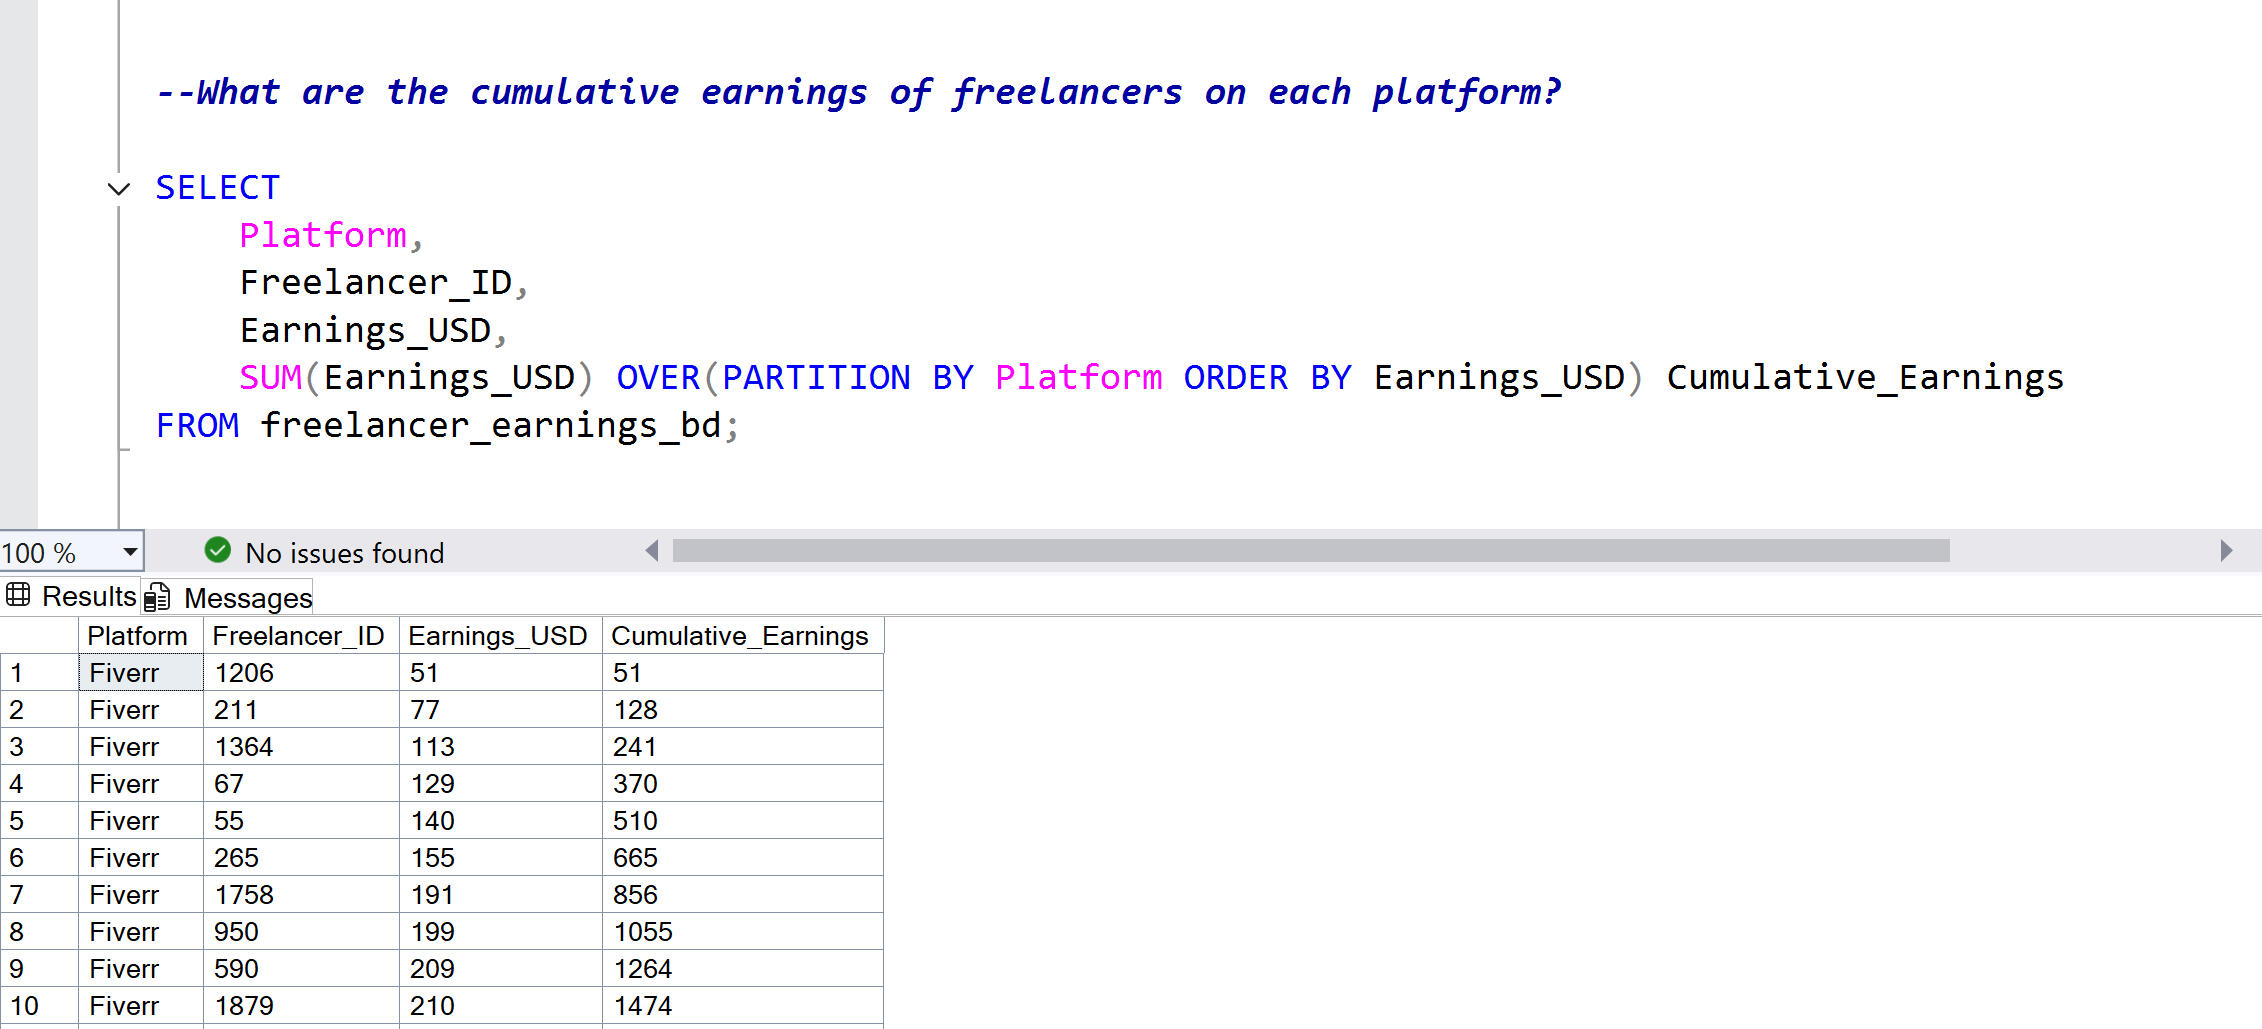
11. Cumulative Earnings by Platform
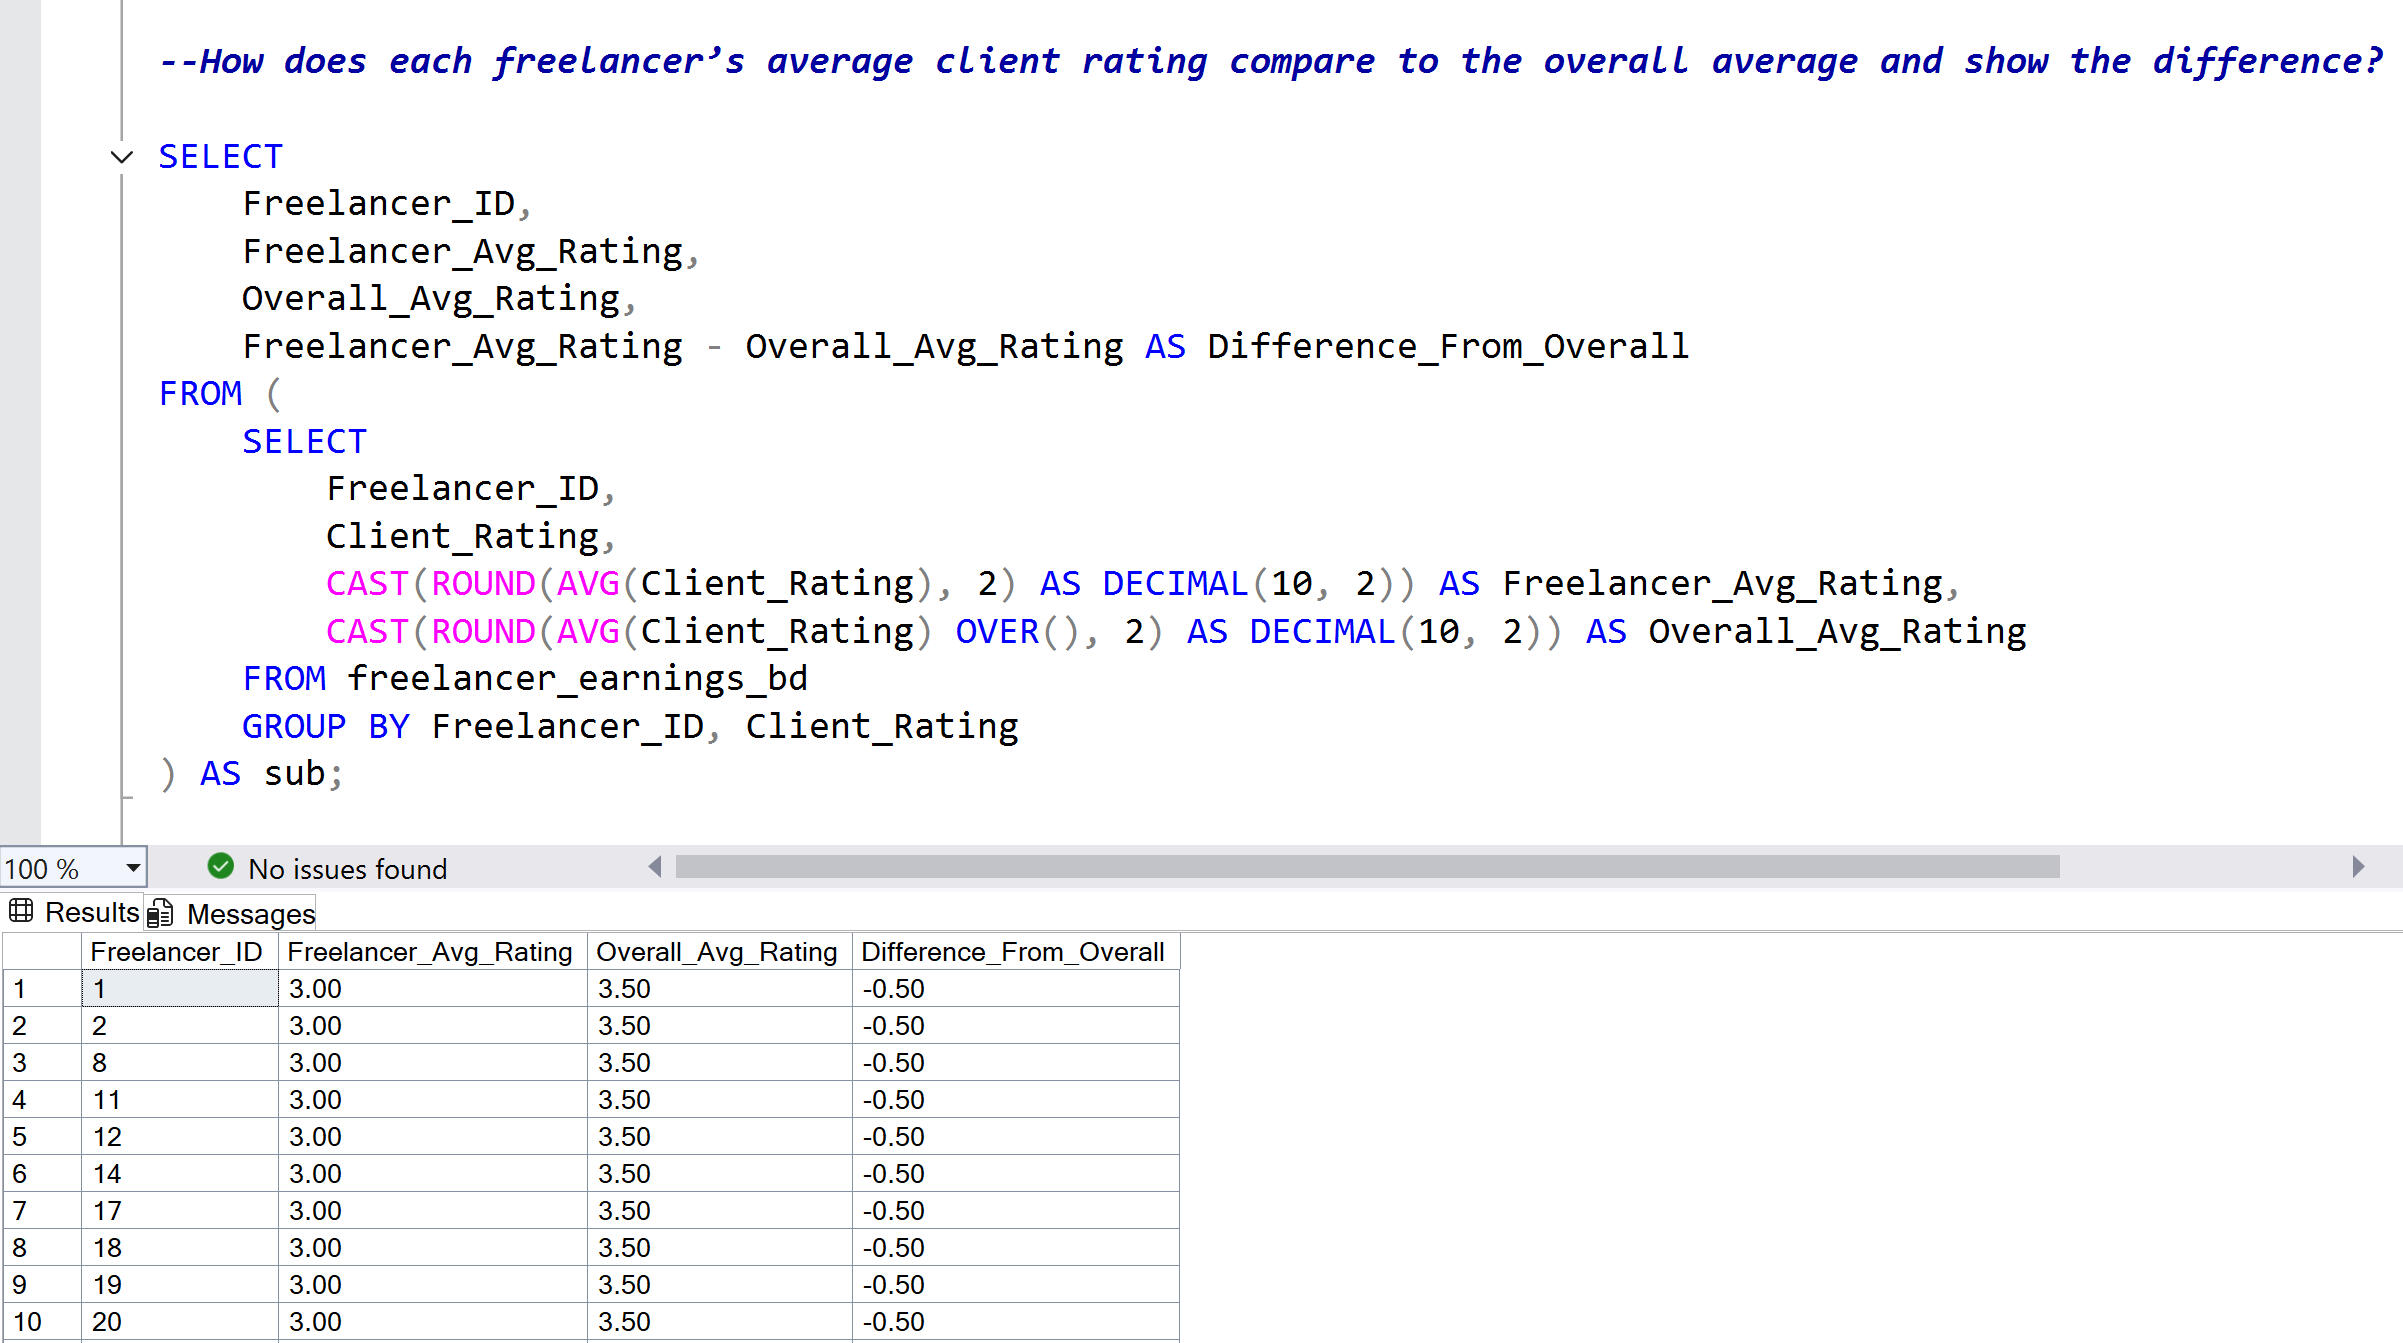
12. Compare Average Client Rating to Overall Average and Show the Difference
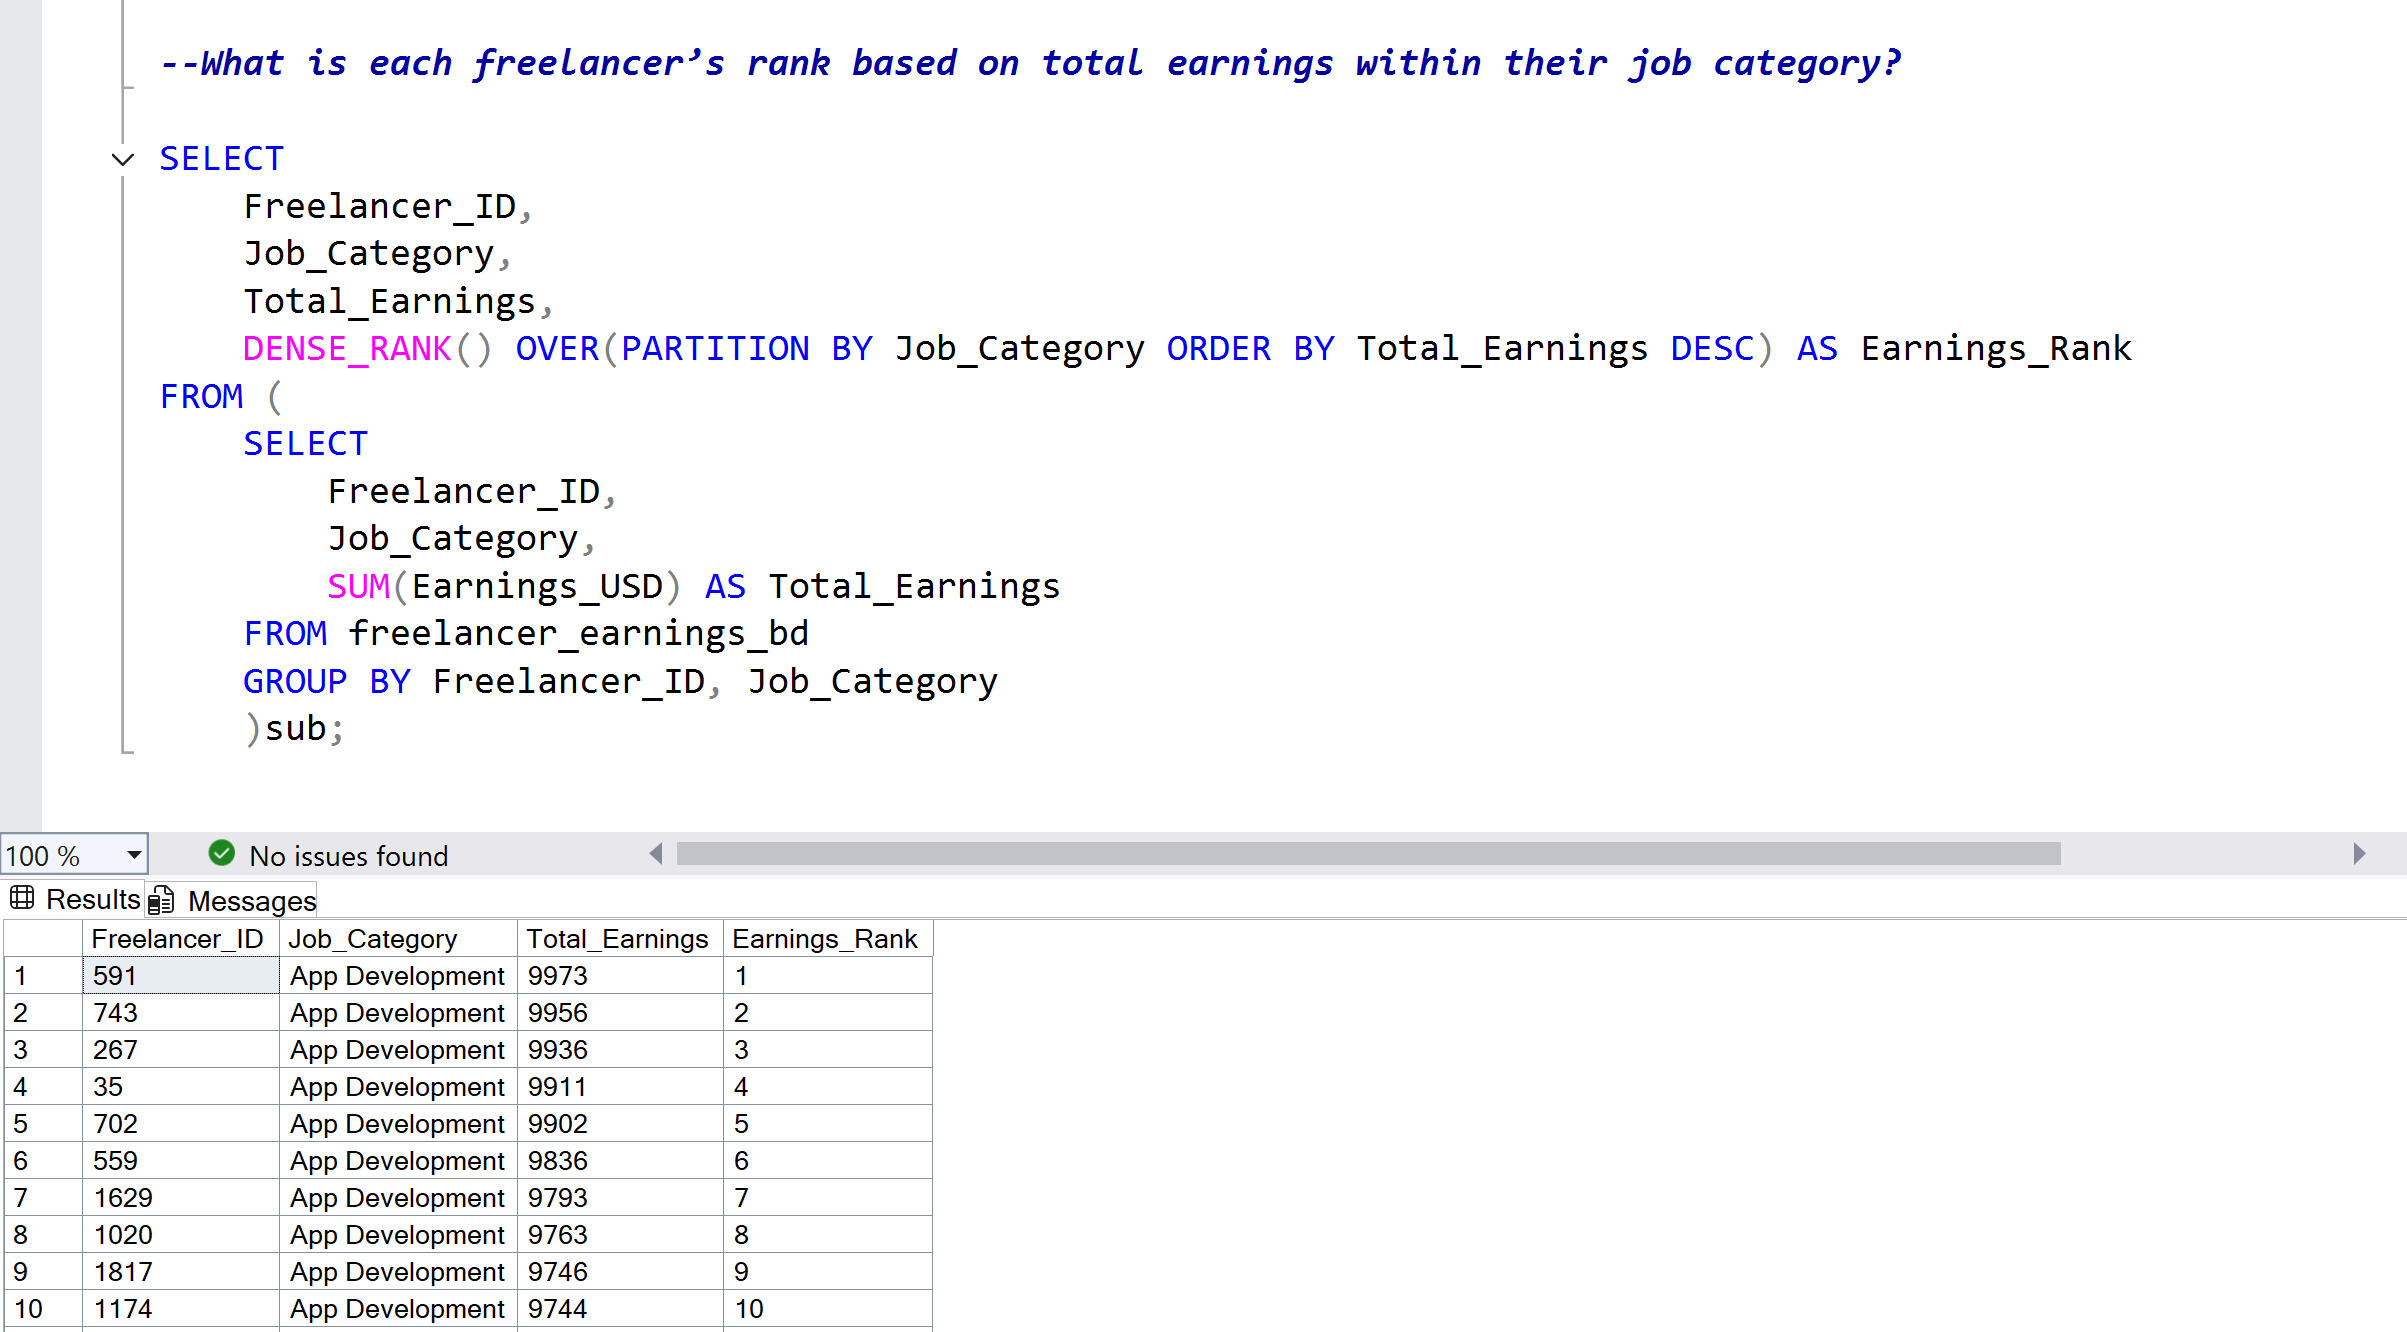
13. Freelancers Ranked by Total Earnings in Job Categories
© 2026 LaDawn Reid. All rights reserved.
Power BI Dashboard - Bank Churn Analysis
In this two-part project, I've combined technical and strategic business analysis. Using bank customer data, I created an interactive Power BI dashboard to uncover churn patterns, then developed a business case with targeted customer retention strategies.
Business Case
I decided to go beyond visualization and developed a business case to bridge the gap between data insights and business action. This document outlines a targeted business goal designed to reduce customer churn by 10% within six months.
© 2026 LaDawn Reid. All rights reserved.
Stakeholder Presentation - Bank Churn Analysis
This presentation highlights key insights from my analysis of bank customer data. By examining churn patterns and customer behavior, it outlines actionable recommendations to improve retention and support strategic decision-making.
© 2026 LaDawn Reid. All rights reserved.
Luxury Retail Sales Analysis
This dashboard was designed for retail decision-makers evaluating pricing strategy and category performance. It explores data across retail brand sales to uncover where profitability is growing, where it's slipping, and what's driving the difference.
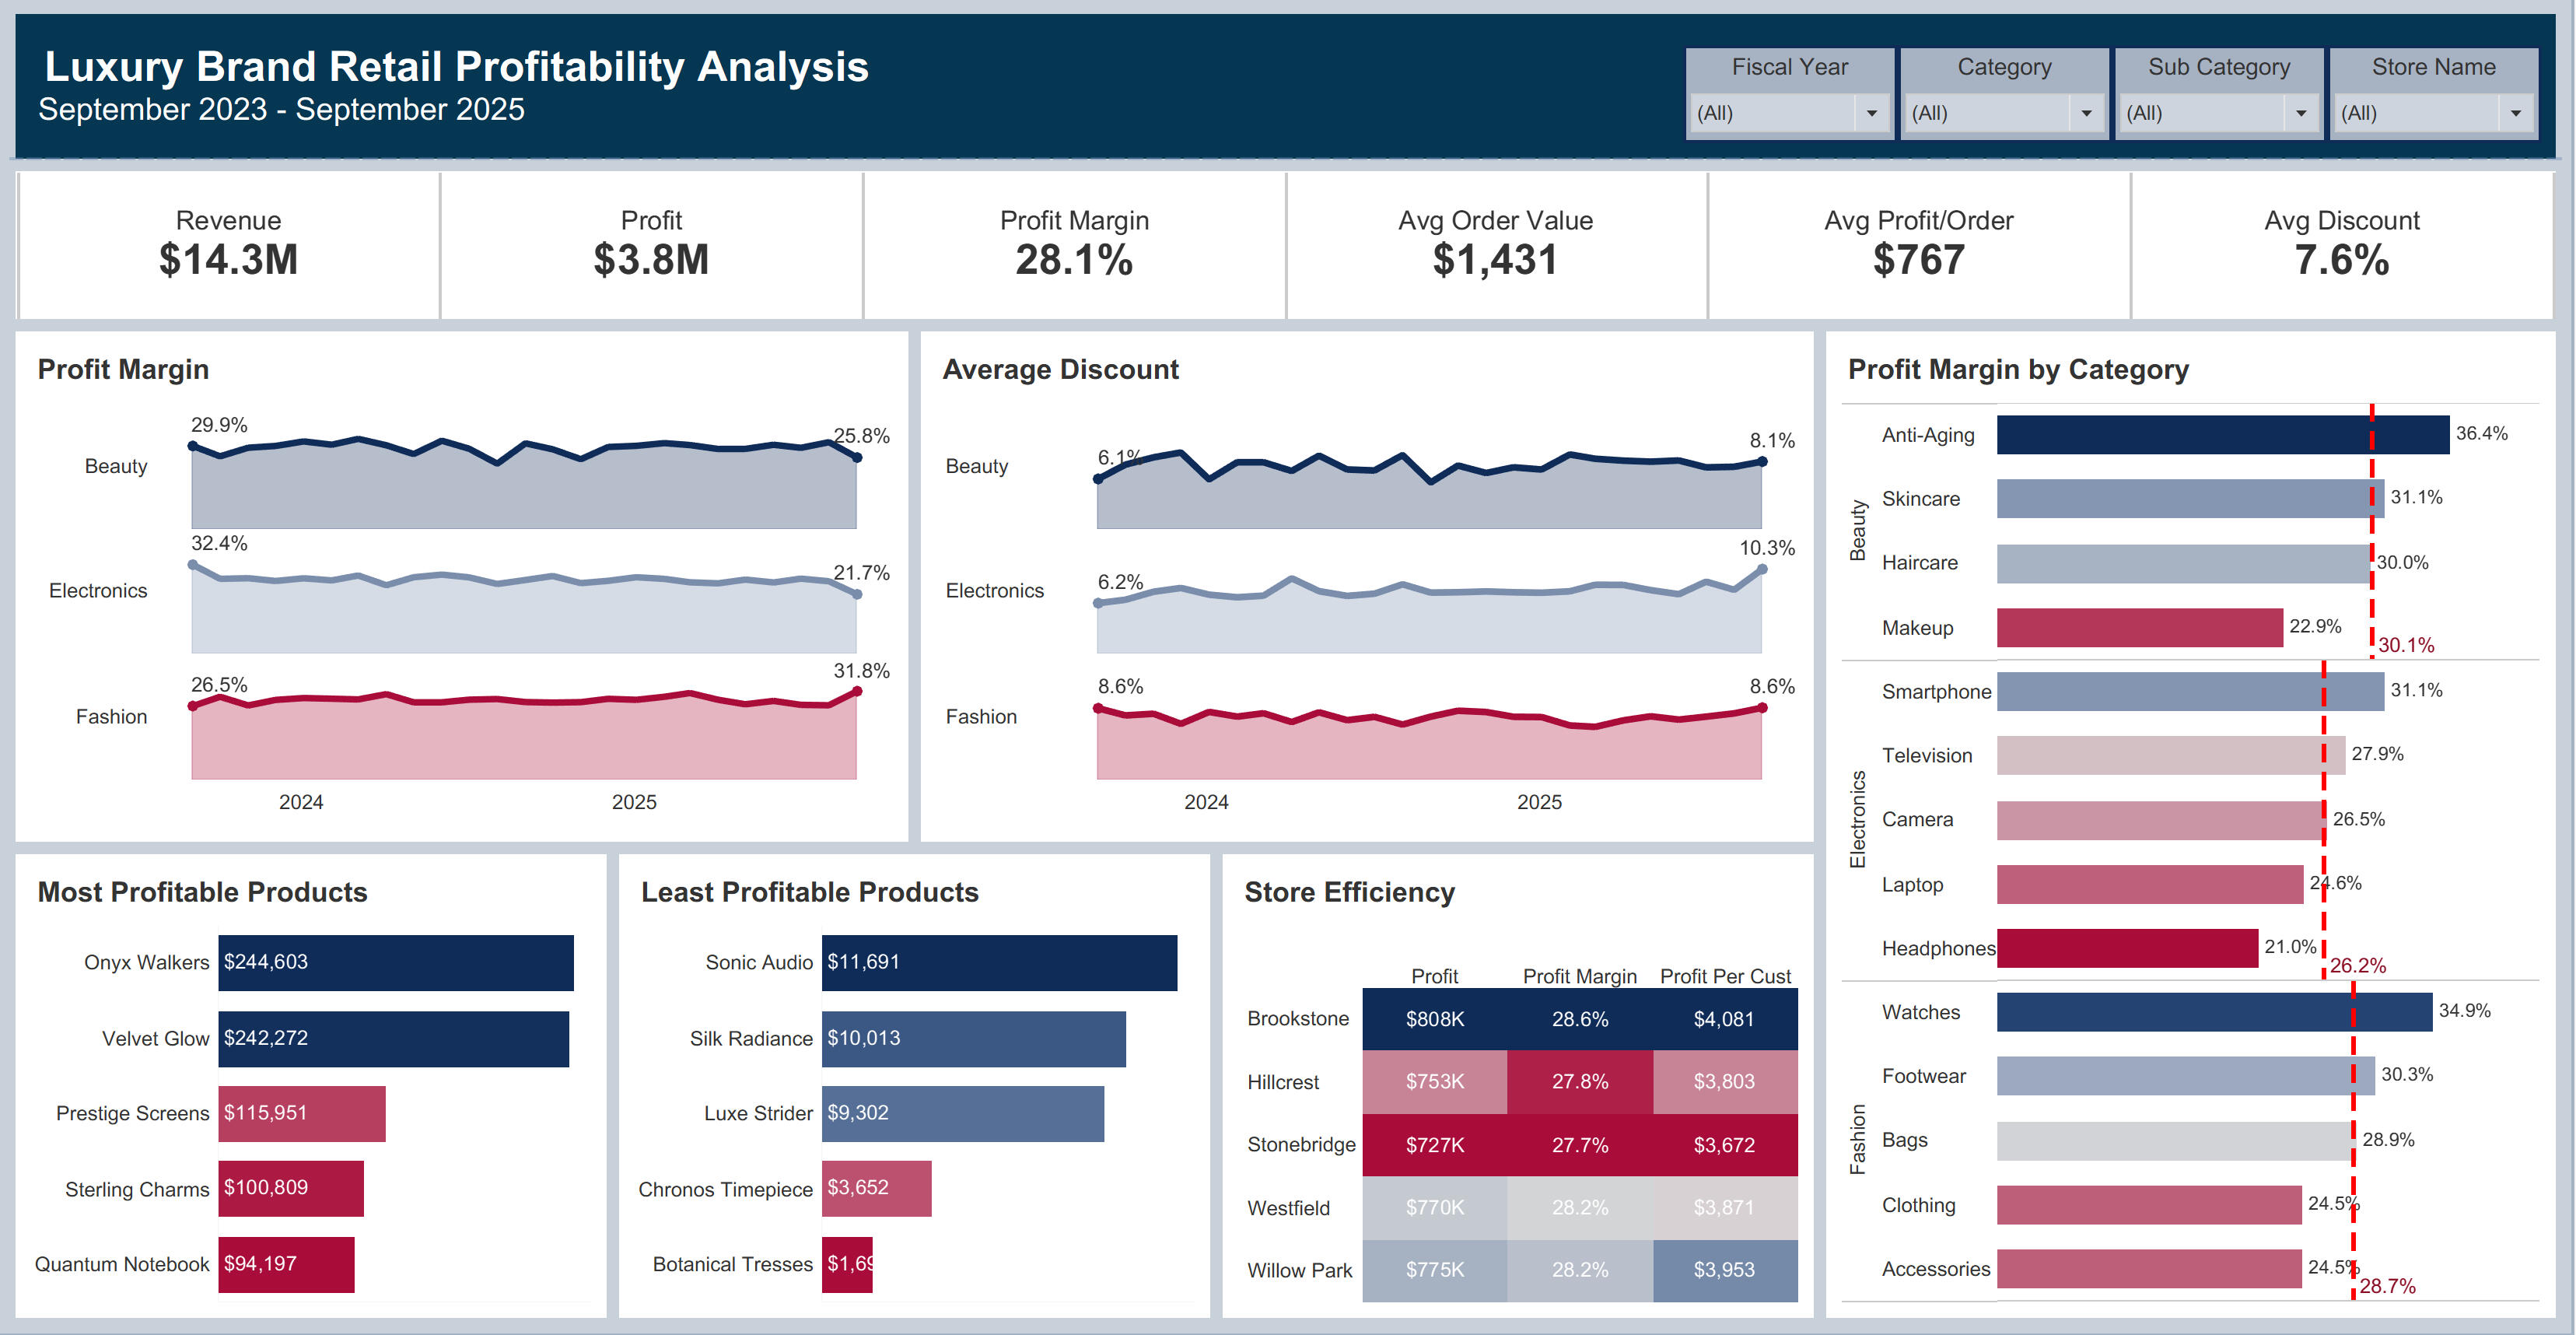
Key Insights
Fashion Leads Overall Profitability: Fashion delivers the strongest margins at 31.8%, with consistent growth driven by high-performing subcategories like Watches.
Electronics and Beauty Show Margin Decline: Both categories show year-over-year margin decline, with rising discount rates likely eroding profitability.
Store Performance is Consistent Across Locations: Profit per customer ranges from $3,672 to $4,081, indicating relatively uniform performance and limited variation in store efficiency.
Subcategory Performance Highlights Pricing Opportunities: High-performing subcategories like Anti-Aging (36.4%) significantly outperform lower-margin areas such as Headphones (21%), highlighting opportunities for pricing and promotion adjustments.
Recommendations
Optimize Discounting in Electronics and Beauty: Margins are declining alongside higher discount rates, suggesting over-discounting. Refine promotions to be more targeted and time-bound to protect profitability.
Expand High-Margin Subcategories: Top performers like Anti-Aging (36.4%) present strong profit opportunities. Increase visibility through marketing, bundling, or premium positioning to drive growth.
Reevaluate Low-Margin Products: Subcategories like Headphones (21%) may be underpriced or over-discounted. Review pricing and cost structure to improve margins.
Prioritize Category Strategy Over Store Optimization: Consistent store performance indicates limited gains at the location level. Focus on category and product-level strategies where margin differences are greatest.
This analysis turns the data into a clear business narrative, helping identify where profitability is growing, where it’s at risk, and where strategic adjustments can drive better outcomes.
E-Commerce Customer Behavior Analysis
This dashboard was designed for e-commerce decision-makers looking to better understand what drives customer spending and loyalty. It examines revenue trends, discount effectiveness, and customer engagement by uncovering key factors that influence customer value and overall business growth.
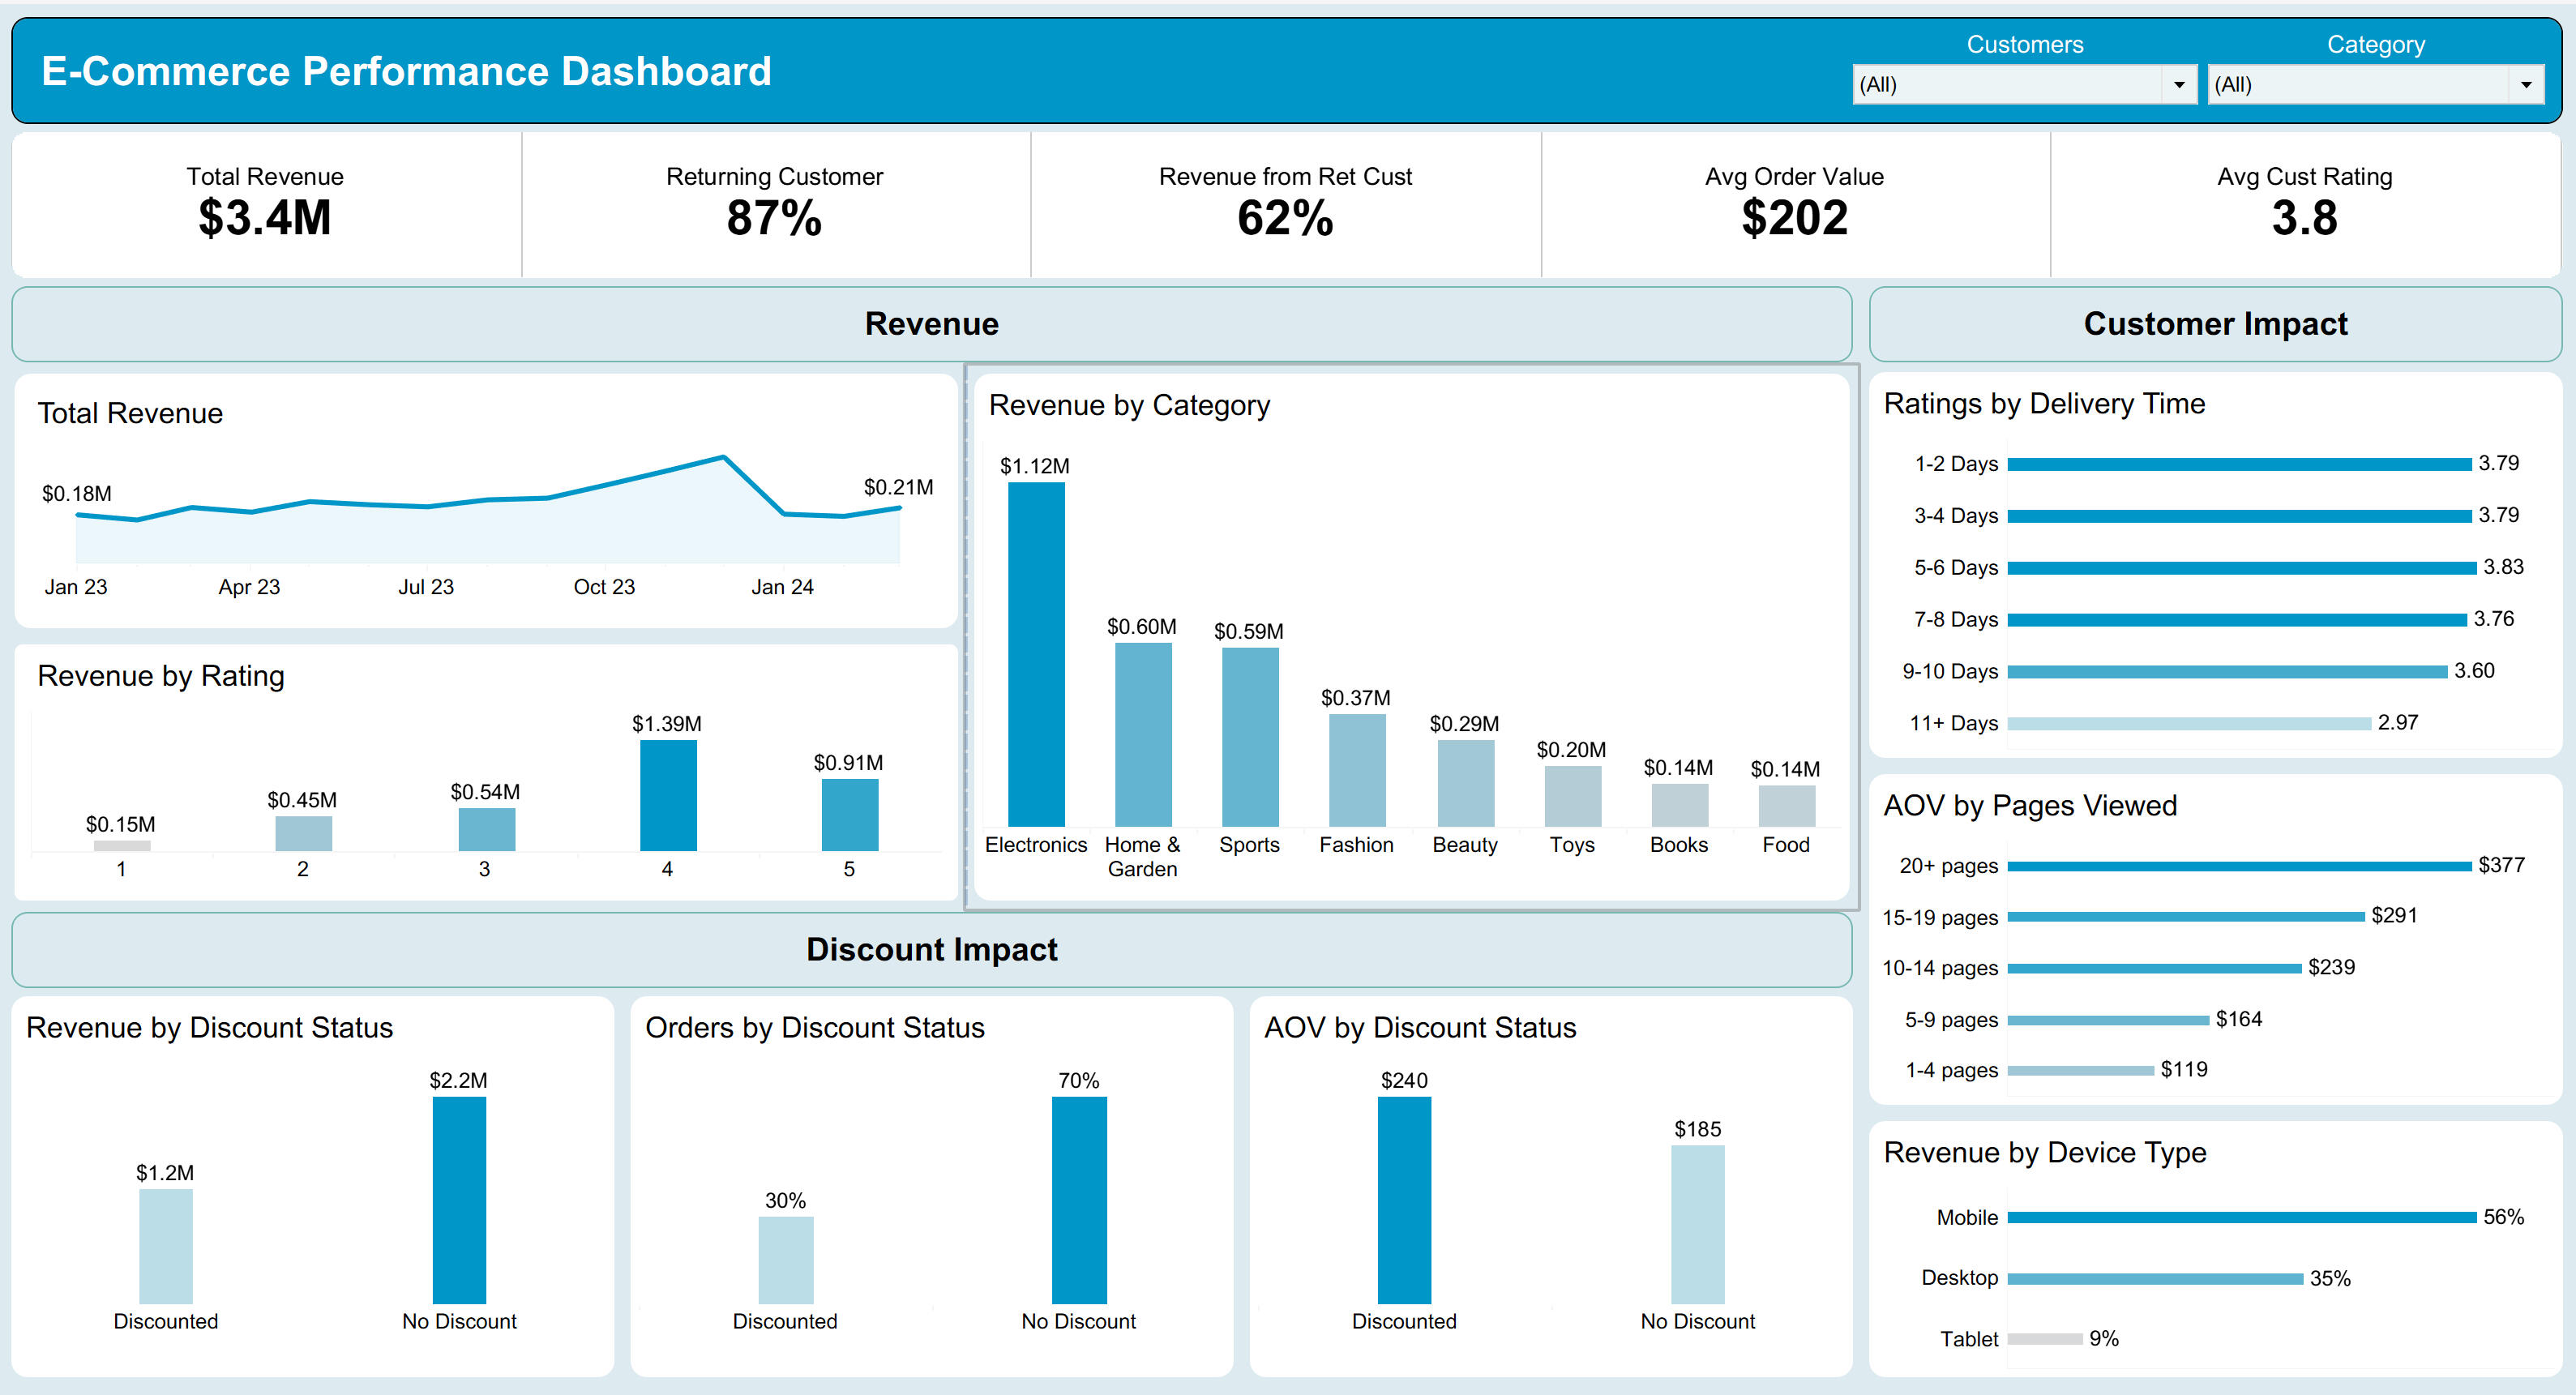
Key Insights
Returning customers are the backbone of the business: 87% of customers are repeat buyers, accounting for 62% of total revenue, a $202 average order value, and a 3.8 out of 5 satisfaction rating.
Electronics carries the revenue: At $1.12M, Electronics brings in nearly twice the revenue of the next closest category, with Home & Garden and Sports trailing behind.
Discounts are being used selectively: Only 30% of orders include a discount, but those orders average a higher order value ($240) than full-price orders ($185), suggesting discounts are attached to larger purchases rather than used widely.
Delivery speed affects satisfaction: Ratings hold steady for orders delivered within 6 days but drop sharply to 2.97 for orders taking 11 or more days.
Engaged shoppers spend more: Customers who viewed 20 or more pages averaged $377 per order, compared to just $119 for low-engagement sessions.
Mobile is the dominant channel: 56% of revenue comes from mobile, outpacing desktop and tablet combined.
Recommendations
Protect and reward the loyal customer base: Consider loyalty incentives tied to spending milestones to encourage larger orders and repeat purchases with returning customers who drive the majority of revenue.
Reduce dependence on Electronics: Identify which secondary categories have the most growth potential and invest in promoting them more actively to reduce risk associated with strong performance in one category.
Keep discount strategy targeted: Expand the current approach with the goal of attracting new customers or boosting underperforming categories, being careful to avoid hurting margins without adding value.
Address the delivery experience for slower orders: Investigate fulfillment delays for late orders or set better expectations upfront to protect customer satisfaction for orders taking more than 10 days.
Invest in product discovery: Improve search, recommendations, and navigation — especially on mobile — to directly increase revenue per visit.
This analysis translates customer behavior data into a clear business story — to identify what is driving revenue today and provide targeted adjustments to drive meaningful growth.
© 2026 LaDawn Reid. All rights reserved.